

Adjust Your Seeding Rate (Higher) But Not Your Maturity Group For Late May Planted Soybean
Adapted from original article written in 2018 by Authors: S.P.Conley, J.M Gaska, S. Mourtiznis, D. Mueller, and A. Varenhorst
With only 8 days left in May and roughly only 57% of the WI soybean crop planted what if any production changes should growers consider modifying?
- Do Not Switch Your Maturity Group….Yet: Do not consider switching to an earlier soybean maturity group until ~June 1. After June 1 do not go any earlier than a 0.5 MG earlier variety. For more information please see: Soybean Planting Date and Maturity Group Considerations Moving into 2019.
- Increase your seeding rate to roughly 154,000 seeds per acre. Efficacy of soybean seed-applied fungicide and insecticide at early and late planting dates and a range of seeding rates were tested in multiple states during the 2016 and 2017 growing seasons. Researchers in Iowa, South Dakota, and Wisconsin participated with 4 locations each year for a total of 24 location/years. Seed treatments included a) UTC, b) fungicide (prothioconazole, penflufen, and metalaxyl), and c) fungicide+insecticide (clothianidin). Only late planting dates were used in this below analysis. The average of the late planting dates for each state over the two years were: IA: May 24, SD: June 21, and WI: May 31. Seeding rates were in increments of 20,000 from 60,000 to 160,000 seeds/acre. There was a quadratic yield response to seeding rate that was significant (Figure 1). Maximum yield was observed at 154,000 seeds/acre. The curve is not very steep which shows that practical yield differences between seeding rates were not large. So, the curve does not tell the whole story. We re-ran the model with seeding rate as a categorical variable. The results suggest that yields for 140 and 160K were not different and 100-140K were not different either (Table 1). It may be argued that our seeding rate was not extended high enough…I assume my Twitter “friends” will come back and say “hey bean boy why didn’t you go to 180 or 220,000 seeds per acre”. That is a valid critique however given the flat response curve we find it difficult to believe we would have seen a significant yield response above where we are. As a reminder our recommended seeding rate for early planted soybean can be found here: Just the Facts Jack: Soybean Planting Date, Seeding Rate, Pre-Herbicide Timing, and Seed Treatment Recommendations .
- Interpret the below information on return above seed cost cautiously. The best part of writing in a blog format is that you get to tweak the post after it is originally published. To that point we had several comments last year on the the small yield response difference between seeding rates and question the optimal farmer return above seed cost. If you were to look only at that factor the optimal seeding rate would be ~100,000 seeds per acre even at a late May planting (Table 2). Though those economic numbers are very appealing I would caution growers to not go this low if they have uneven or rocky fields as harvestabilty will be a challenge with a lower soybean pod set. Furthermore many soybeans will be “planted” and I use that term loosely into unfavorable environments (wet and compacted soils) and emergence issues will be likely. I would also not go this low in fields that are prone to drought as the rows will be slower to canopy and lead to greater soil water evaporation and subsequent weed competition. This leads us to waterhemp and its wonderful biology of delayed germination and prolific seed set. The point I am trying to make is this is a system and as Paul Harvey so eloquently stated……”now for the rest of the story”!
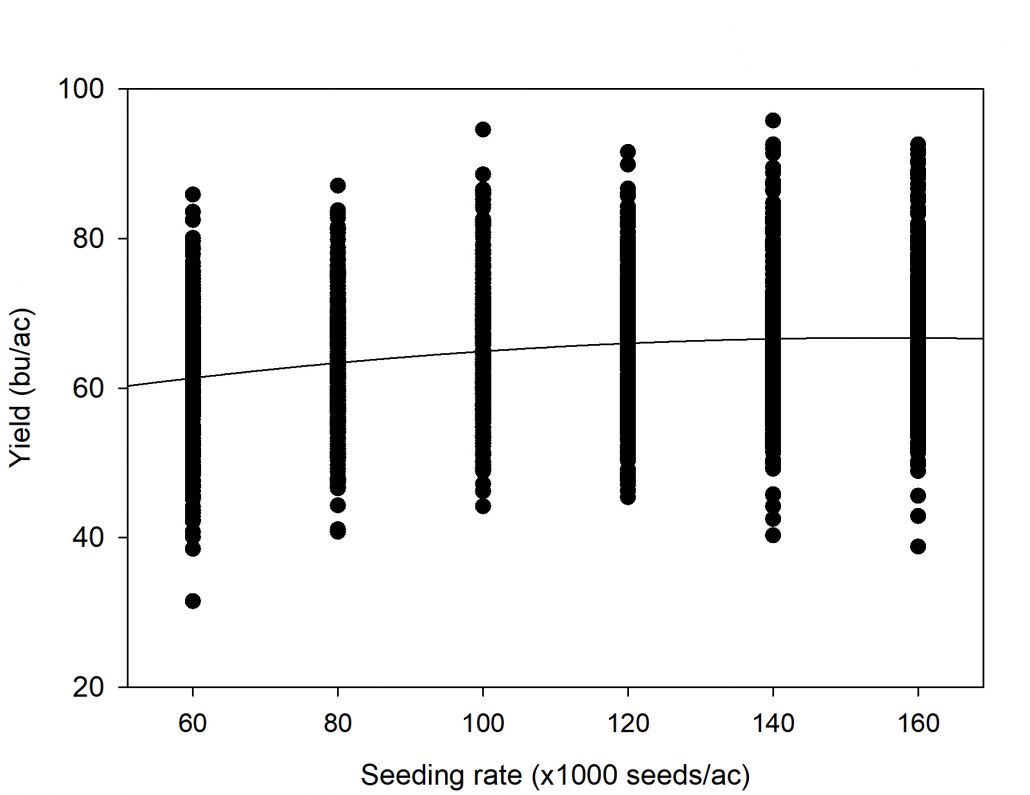 Figure 1. Soybean seed yield response to seeding rate for soybean planted in Late May and June in IA, WI, and SD.
Table 1. Mean soybean seed yield response to seeding rate for soybean planted in Late May and June in IA, WI, and SD.
|
Soybean seeding rate (1000 seeds per acre) |
Soybean Seed Yield (bu per acre) |
|
| 160 | 67.3 | A |
| 140 | 66.6 | AB |
| 120 | 66.0 | B |
| 100 | 65.8 | B |
| 80 | 63.8 | C |
| 60 | 61.6 | D |
| Tukey-Kramer Least Squares Means (Alpha=0.05); LS-means with the same letter are not significantly different. | ||
Table 2. Return above seed cost at various market prices for seeding rates over 60000 seeds/acre.
|
Seeding rate |
Yield |
Yield difference compared to 60000 seeds/a |
Soybean market price ($/bu) |
||||
|
10.00 |
11.00 |
12.00 |
13.00 |
14.00 |
|||
|
seeds/a |
bu/a |
—–bu/a—– |
——– ——– $/acre ————— |
||||
| 60000 |
61.6 |
Base |
|||||
| 80000 |
63.8 |
2.2 |
12.70 | 14.90 | 17.10 | 19.30 | 21.50 |
| 100000 |
65.8 |
4.2 |
23.40 | 27.60 | 31.80 | 36.00 | 40.20 |
| 120000 |
66.0 |
4.4 |
16.10 | 20.50 | 24.90 | 29.30 | 33.70 |
| 140000 |
66.6 |
5.0 |
12.90 | 17.90 | 22.90 | 27.90 | 32.90 |
| 160000 |
67.3 |
5.7 |
10.60 | 16.30 | 22.00 | 27.7 | 33.40 |
| Based on $65.00/140000 seeds | |||||||