
Authored by Lindsay Chamberlain (UW), Jim Specht (UNL) and Shawn P. Conley (UW)
August 1st is right around the corner and crop maturity timing concerns have erupted! These concerns are amplified in 2019 due to historically low GDU accumulations and late plantings that have significantly delayed overall soybean crop progress. Below we provide some estimates of specific crop developmental stages from both measured data in 2017 at our Arlington research station and estimated crop development using UNL SoyWater. Please use this information provided as estimates and not hard facts.
In 2017, we planted soybeans ranging from MG 0.2 to MG 7.5 in Arlington, WI on June 1 to see how these different MGs responded in WI. Fehr and Caviness soybean growth stages were noted twice per week, including the “Beginning” and “End” of each grain-fill (R3-R6) growth stage. The “beginning” was noted when the size pod was present anywhere on the plant, and the “end” was when no more pods of that stage were present. The Fehr and Caviness growth stage system refers to the top 4 nodes only, so pods of many stages can be on the plant at the same time. The beginning and end of each growth stage is noted on the figure by the colored lines, and the entire width of the colored lines depict the grain fill period (Figure 1). Using 30 year climatology data (Figure 2.), albeit a bit out dated, there is a 50% risk that a 3.0 or later soybean planted on June 1 will experience 32 degree temperature during the R7 growth stage. This one year of observation is also confirmed using the SoyWater model (Table 1). Additional planting date by maturity group combinations that are at risk (50%) of freeze damage in the R7 growth stage in southern WI are highlighted below in Table 1. Those cells that contain a (-) are not likely to reach maturity.
A similar analysis was conducted using SoyWater for our Chippewa Falls location. Planting date by maturity group combinations that are at risk (50%) of freeze damage in the R7 growth stage in northern WI are highlighted below in Table 2. Those cells that contain a (-) are not likely to reach maturity.
We feel that these values are robust and provide growers with a reasonable risk assessment for the given planting date by maturity group interactions. Regardless lets all hope for a late and dry fall!
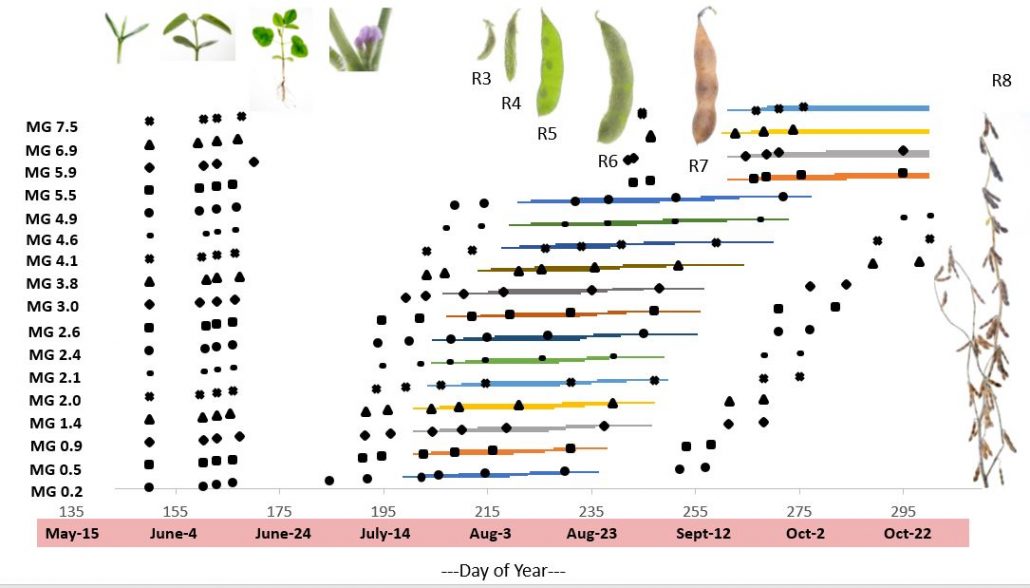
Image 1. Phenological development of several maturity group soybeans (0.2 to 7.5) grown at Arlington WI in 2017.
Table 1. Estimated Soybean Developmental Stages for Arlington WI using SoySim Based on Soybean Planting Date and Maturity Group.
| Planting Date | MG | R1 | R3 | R5 | R7 |
| 15-May-19 | 1 | 7-Jul | 20-Jul | 7-Aug | 29-Aug |
| 15-May-19 | 1.5 | 11-Jul | 24-Jul | 12-Aug | 7-Sep |
| 15-May-19 | 2 | 13-Jul | 29-Jul | 16-Aug | 14-Sep |
| 15-May-19 | 2.5 | 14-Jul | 31-Jul | 19-Aug | 19-Sep |
| 15-May-19 | 3 | 15-Jul | 2-Aug | 22-Aug | 24-Sep |
| 1-Jun-19 | 1 | 15-Jul | 29-Jul | 14-Aug | 3-Sep |
| 1-Jun-19 | 1.5 | 17-Jul | 31-Jul | 17-Aug | 11-Sep |
| 1-Jun-19 | 2 | 21-Jul | 5-Aug | 22-Aug | 20-Sep |
| 1-Jun-19 | 2.5 | 23-Jul | 7-Aug | 25-Aug | 26-Sep |
| 1-Jun-19 | 3 | 24-Jul | 10-Aug | 29-Aug | 1-Oct |
| 15-Jun-19 | 1 | 22-Jul | 4-Aug | 19-Aug | 8-Sep |
| 15-Jun-19 | 1.5 | 25-Jul | 7-Aug | 23-Aug | 17-Sep |
| 15-Jun-19 | 2 | 29-Jul | 10-Aug | 26-Aug | 25-Sep |
| 15-Jun-19 | 2.5 | 31-Jul | 13-Aug | 30-Aug | 1-Oct |
| 15-Jun-19 | 3 | 2-Aug | 16-Aug | 3-Sep | 8-Oct |
| 30-Jun-19 | 1 | 9-Aug | 19-Aug | 1-Sep | 21-Sep |
| 30-Jun-19 | 1.5 | 14-Aug | 24-Aug | 6-Sep | 4-Oct |
| 30-Jun-19 | 2 | 17-Aug | 27-Aug | 12-Sep | 16-Oct |
| 30-Jun-19 | 2.5 | 20-Aug | 30-Aug | 18-Sep | 29-Oct |
| 30-Jun-19 | 3 | 22-Aug | 2-Sep | 24-Sep | 21-Nov |
| 15-Jul-19 | 1 | 26-Aug | 3-Sep | 19-Sep | 10-Oct |
| 15-Jul-19 | 1.5 | 30-Aug | 8-Sep | 26-Sep | 29-Oct |
| 15-Jul-19 | 2 | – | – | – | – |
| 15-Jul-19 | 2.5 | – | – | – | – |
| 15-Jul-19 | 3 | – | – | – | – |
Cells with a (-) indicate that SoyWater did not compute Rn stages for that planting date and maturity group because the growing season is too short to reach physiological maturity.
Table 2. Estimated Soybean Developmental Stages for Chippewa Falls WI using SoySim Based on Soybean Planting Date and Maturity Group.
| Planting Date | MG | R1 | R3 | R5 | R7 |
| 15-May-19 | 1 | 2-Jul | 16-Jul | 3-Aug | 26-Aug |
| 15-May-19 | 1.5 | 6-Jul | 20-Jul | 8-Aug | 5-Sep |
| 15-May-19 | 2 | 9-Jul | 24-Jul | 12-Aug | 12-Sep |
| 15-May-19 | 2.5 | 11-Jul | 27-Jul | 15-Aug | 18-Sep |
| 15-May-19 | 3 | 12-Jul | 29-Jul | 19-Aug | 22-Sep |
| 1-Jun-19 | 1 | 10-Jul | 23-Jul | 9-Aug | 31-Aug |
| 1-Jun-19 | 1.5 | 12-Jul | 26-Jul | 12-Aug | 8-Sep |
| 1-Jun-19 | 2 | 14-Jul | 29-Jul | 15-Aug | 15-Sep |
| 1-Jun-19 | 2.5 | 15-Jul | 31-Jul | 18-Aug | 20-Sep |
| 1-Jun-19 | 3 | 16-Jul | 2-Aug | 22-Aug | 25-Sep |
| 15-Jun-19 | 1 | 21-Jul | 2-Aug | 17-Aug | 7-Sep |
| 15-Jun-19 | 1.5 | 24-Jul | 5-Aug | 21-Aug | 16-Sep |
| 15-Jun-19 | 2 | 26-Jul | 8-Aug | 24-Aug | 24-Sep |
| 15-Jun-19 | 2.5 | 30-Jul | 12-Aug | 29-Aug | 3-Oct |
| 15-Jun-19 | 3 | 30-Jul | 13-Aug | 1-Sep | 8-Oct |
| 30-Jun-19 | 1 | 7-Aug | 16-Aug | 31-Aug | 20-Sep |
| 30-Jun-19 | 1.5 | 10-Aug | 20-Aug | 4-Sep | 2-Oct |
| 30-Jun-19 | 2 | 13-Aug | 24-Aug | 9-Sep | 15-Oct |
| 30-Jun-19 | 2.5 | – | – | – | – |
| 30-Jun-19 | 3 | – | – | – | – |
| 15-Jul-19 | 1 | 21-Aug | 30-Aug | 14-Sep | 6-Oct |
| 15-Jul-19 | 1.5 | – | – | – | – |
| 15-Jul-19 | 2 | – | – | – | – |
| 15-Jul-19 | 2.5 | – | – | – | – |
| 15-Jul-19 | 3 | – | – | – | – |
Cells with a (-) indicate that SoyWater did not compute Rn stages for that planting date and maturity group because the growing season is too short to reach physiological maturity.
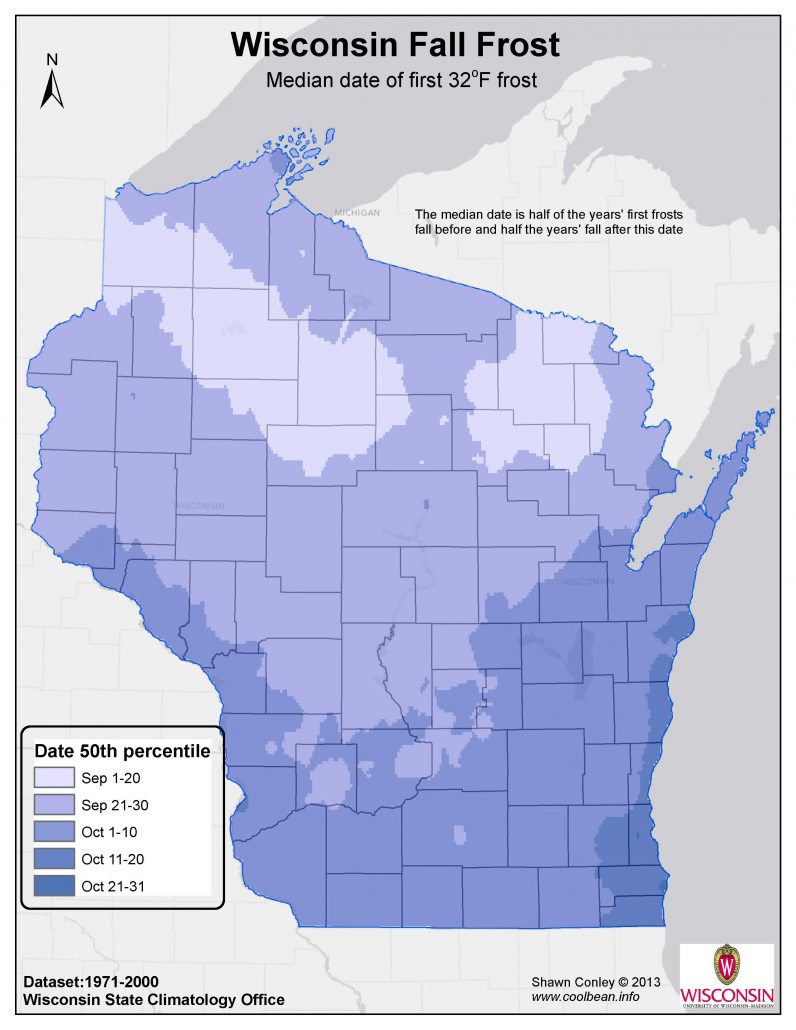
Image 2. Median date of 50th percentile of first 32 degree frost in WI.
sdfbsdfbsfdb