Where in the Deuce Did this Soybean Yield Come From?
Shawn Conley, Spyros Mourtzinis, John Gaska and Adam Roth: UW Madison; Anibal Cerrudo and Seth Naeve: University of Minnesota
Entering the soybean harvest of 2023, numerous Wisconsin soybean farmers were concerned about prolonged dry periods affecting the growing season and potentially resulting in significantly reduced soybean yields. Despite an overall state average yield decrease of 7.4% from 2022 (54 bpa), most farmers were pleasantly surprised with their farm production. The state average of 51 bpa in 2023 matched the previous 5-year average (Image 1). Several key factors contributed to averting a soybean yield disaster in 2023.
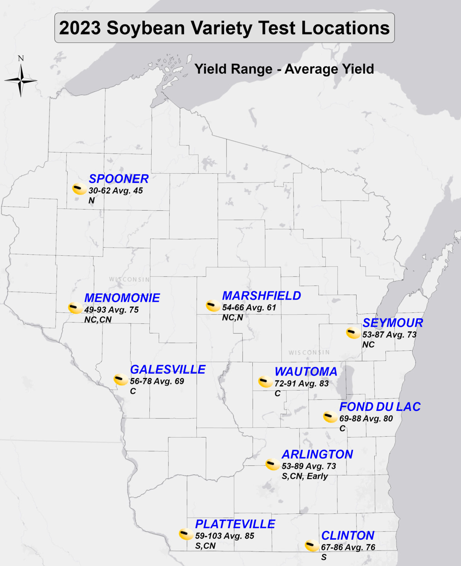
Image 1. Soybean yield data from our variety trials
- Planting date optimization: Encouraging farmers to be aggressive yet sensible and push their soybean planting dates has been an effective strategy for maximizing soybean yield across the Midwest. Here are some key resources to hammer home this point.
- Soil moisture at planting: Farmers in Wisconsin were very fortunate (compared to neighboring states) that our root soil was wetter than normal suggesting that our soil water profile was in good to excellent condition going into the growing season (Image 2). This fact coupled with our moderate to high soil water holding capacity that usually ranges from 4 to 12 inches in most parts of the state (Image 3) suggests our soybean crop would be resilient to an early to mid-season drought. Remember the average soybean crop needs ~20-26 inches of water.

Image 2. Root Zone Soil Moisture Map May 1 2023.
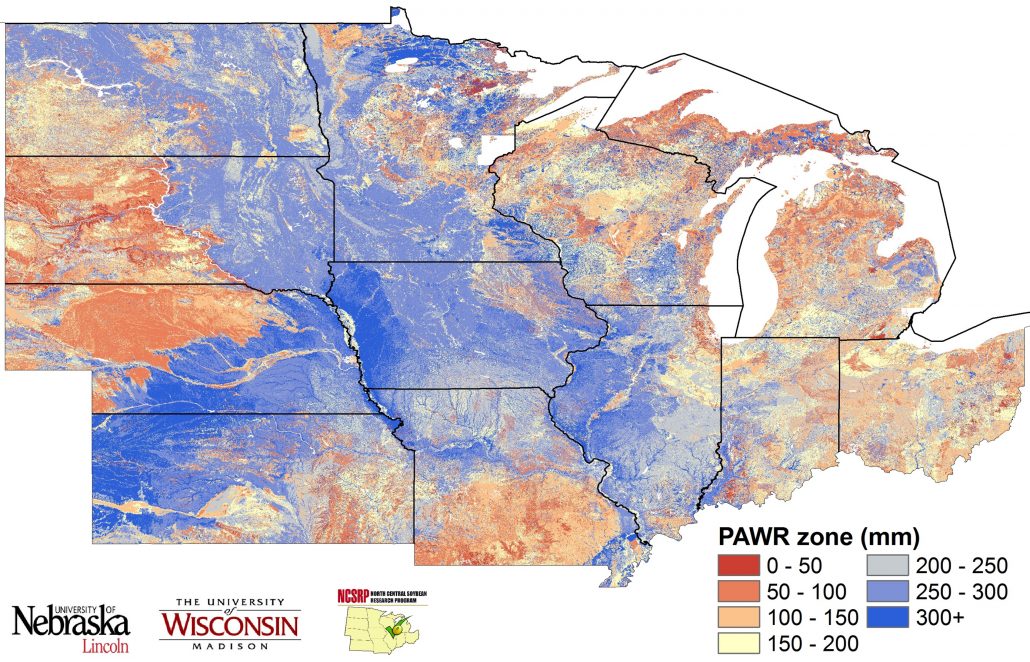
Image 3. Soil water holding capacity
- Low but timely rainfall: Across most of the state, drought intensified during the 2023 growing season as shown in figure 4. However, many parts of the state did receive timely rainfall in July, August and September that maybe were not reflected in the drought map but were captured in our modeling effort described below. Anibal Cerrudo at UMN using the DSSAT CropGro Soybean Mechanistic Model was able to capture yield response to our 2022 and 2023 weather conditions and helped to understand where these soybean yields came from.
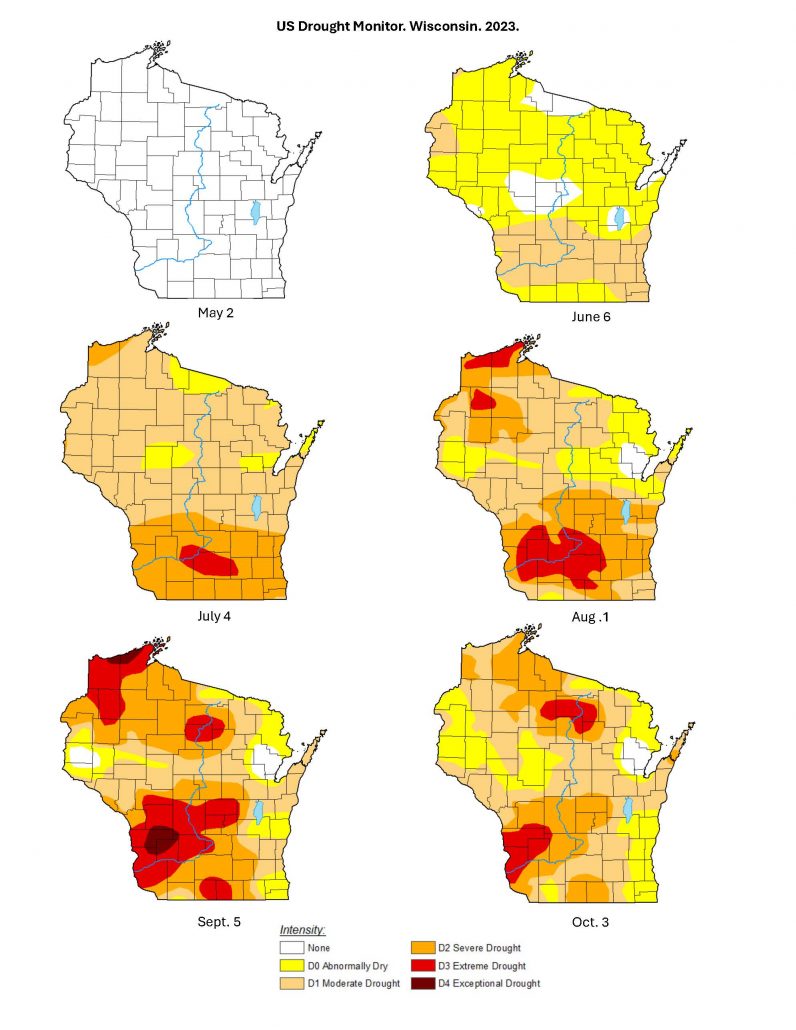
Image 4. WI Drought Map 2023
To get started here are definitions for modeling parameters that help explain the following figures.
- Potential yield (Yp): yield under no water limitation (maximum yield that can be achieved in theory).
- Rainfed 100%sw: yield under rainfed conditions with 100% available water in the soil at planting.
- Rainfed 50%sw: yield under rainfed conditions with 50% available water in the soil at planting.
- Red dots: 90% of maximum yield data from various UW experiments (for comparison purposes).
For Arlington, with a notable soil water storage capacity (280 mm (11 inches) up to 5 feet depth; Image 3), when planting in a fully charged soil we should not expect water stress under the rainfed conditions we experienced in 2022 and 2023. The highest yield data from the experiment (red dots) are close to these predictions in both years (Image 5). If farmers had planted, and the soil water holding capacity was at 50%, given the rainfall patterns observed in 2023, we would have anticipated a yield depression of approximately 10 bpa under the 2023 weather conditions, which received only 266 mm of rain during the growing cycle from May 1st to October 1st (compared to the 502 mm of rain received during the 2022 growing cycle).
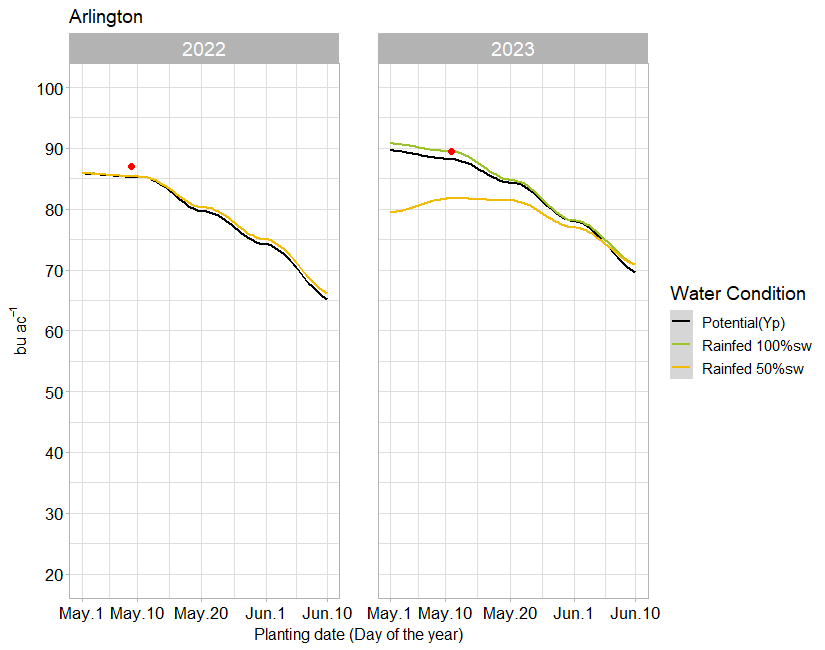
Image 5. Simulated yield data at our Arlington location
For Clinton, with a lower soil water holding capacity (185mm or 7.5 inches up to 5 feet depth; see Image 3), there were no differences between Yp and Yw for 2022 when the rainfall input was 462 mm (May 1st to October 1st; see Image 6). However, in 2023, with a reduced rainfall input of only 335mm (May 1st to October 1st), even when planting in a fully charged soil, we should anticipate water stress and potential yield loss. In instances of water stress, the model indicated a significant window with no impact on planting date, as water limitation played a more crucial role in yield reduction than solar radiation and temperature.
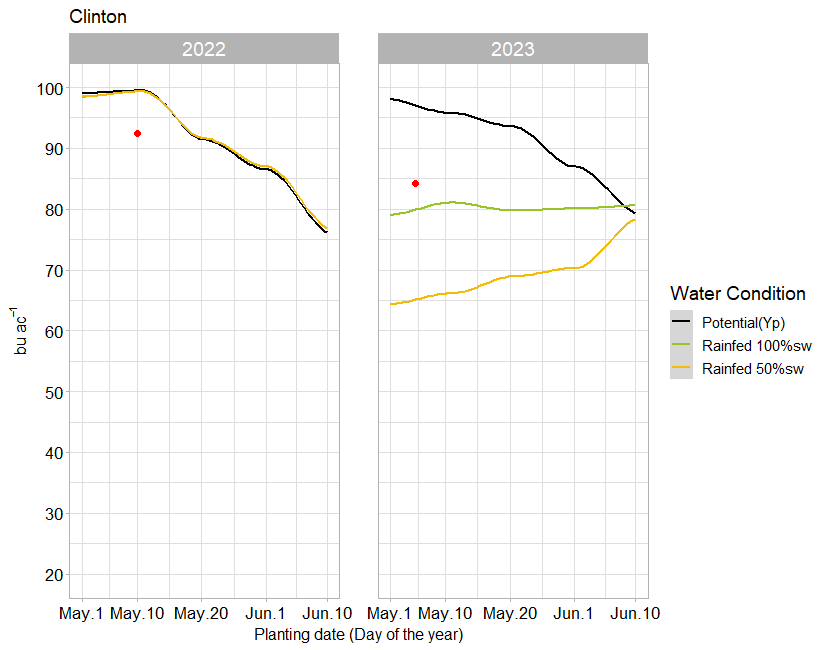
Image 6. Simulated yield from our Clinton location
The key points from this article to remember are as follows:
- Continue to push and optimize your soybean planting date. Though this does not guarantee maximum yield, it sets you up for maximum yield.
- A full water profile going into the growing season is a huge savior.
- Early season drought doesn’t define our growing season.
- Our modeling efforts showed that our relatively good soil profiles along with timely rainfall in July, August and early September really saved our bottom line.
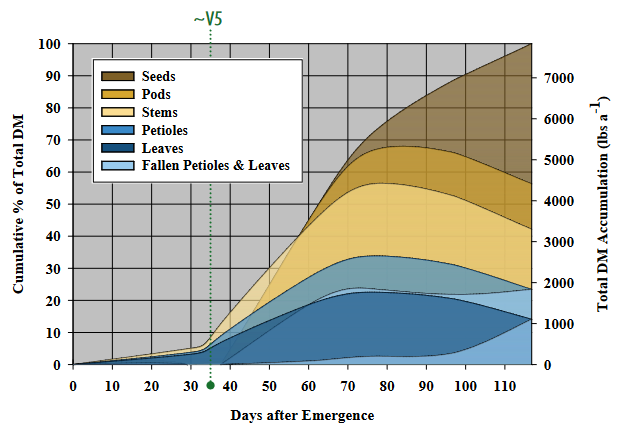
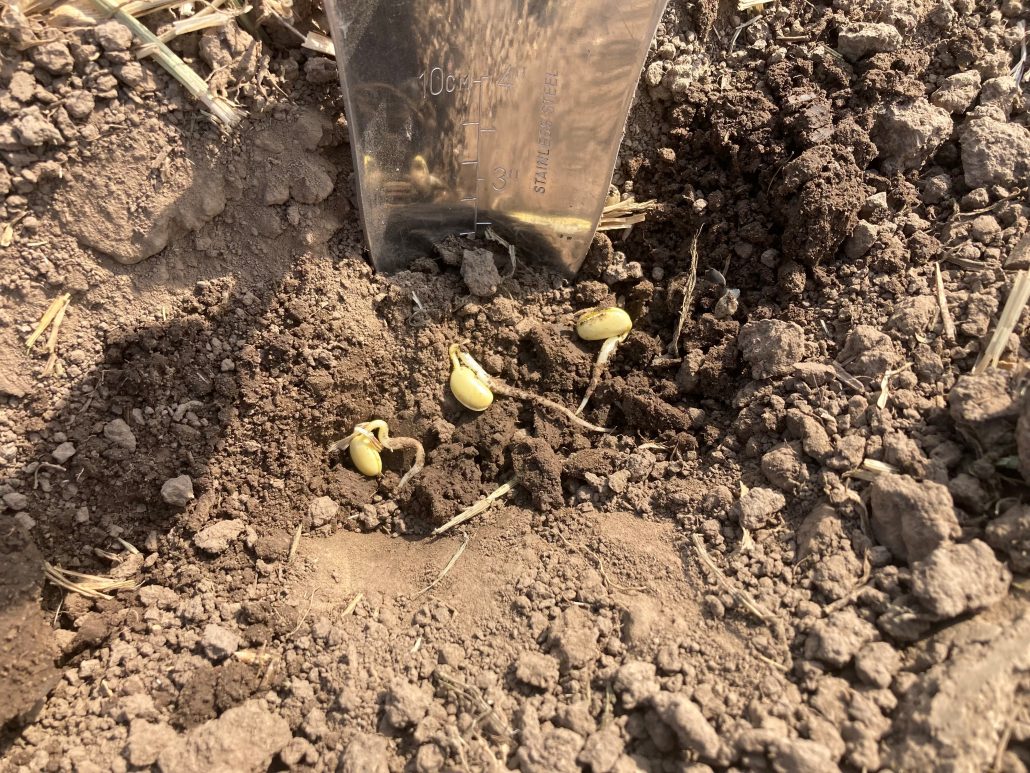
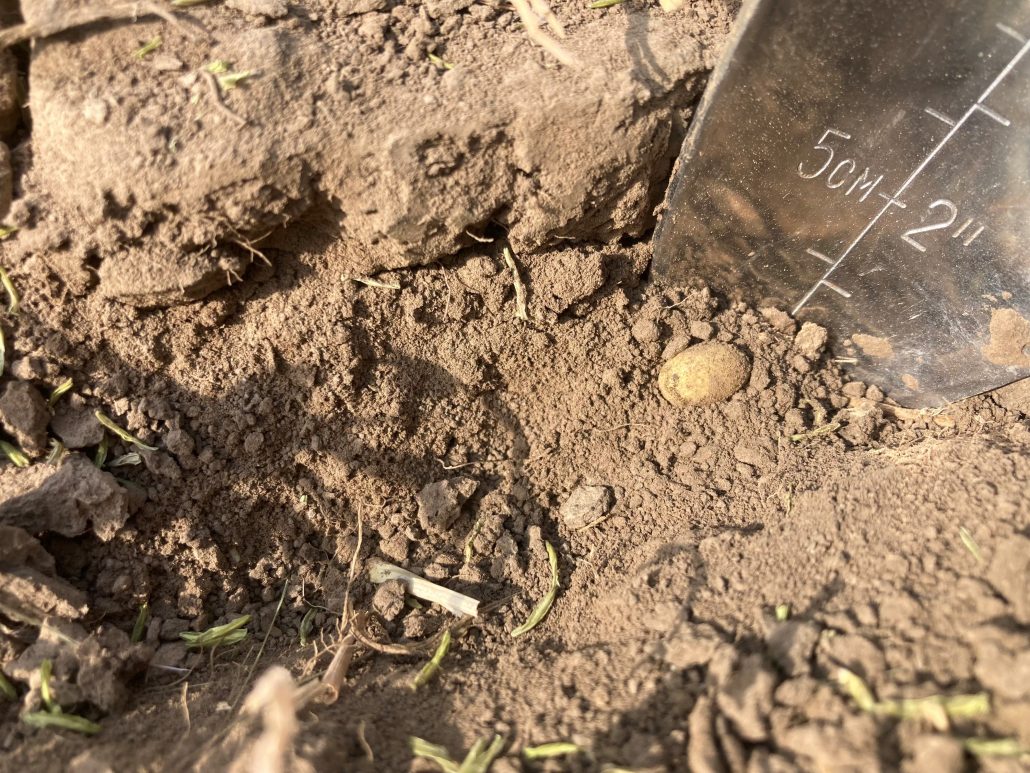
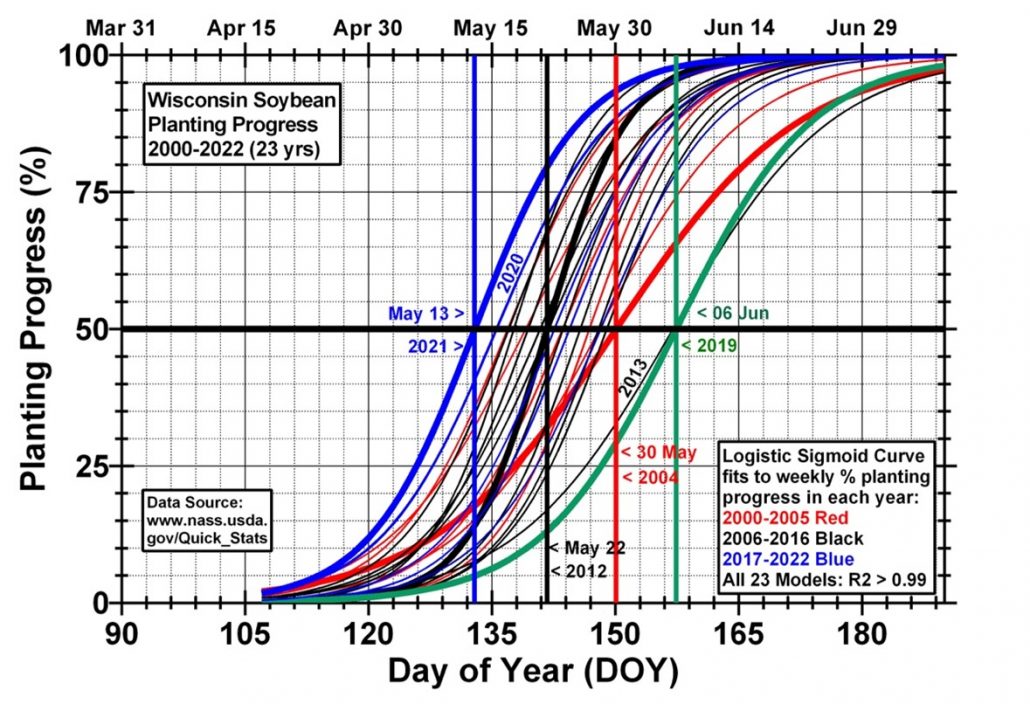
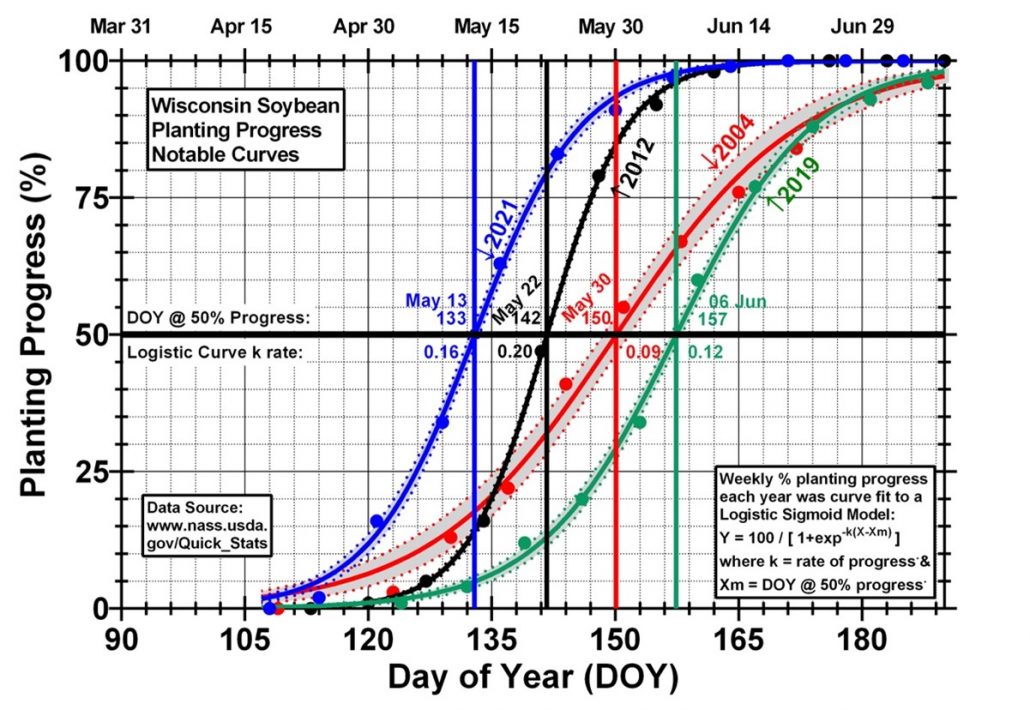 Figure 1. Notable example years (2004, 2012, 2019, and 2021) of soybean planting progress in Wisconsin.