
#Plant20 is going well…but the Bean Team is ready for #Grow20!
Authored by: Lindsay Chamberlain, Spyridon Mourtiznis, John Gaska and Shawn P. Conley
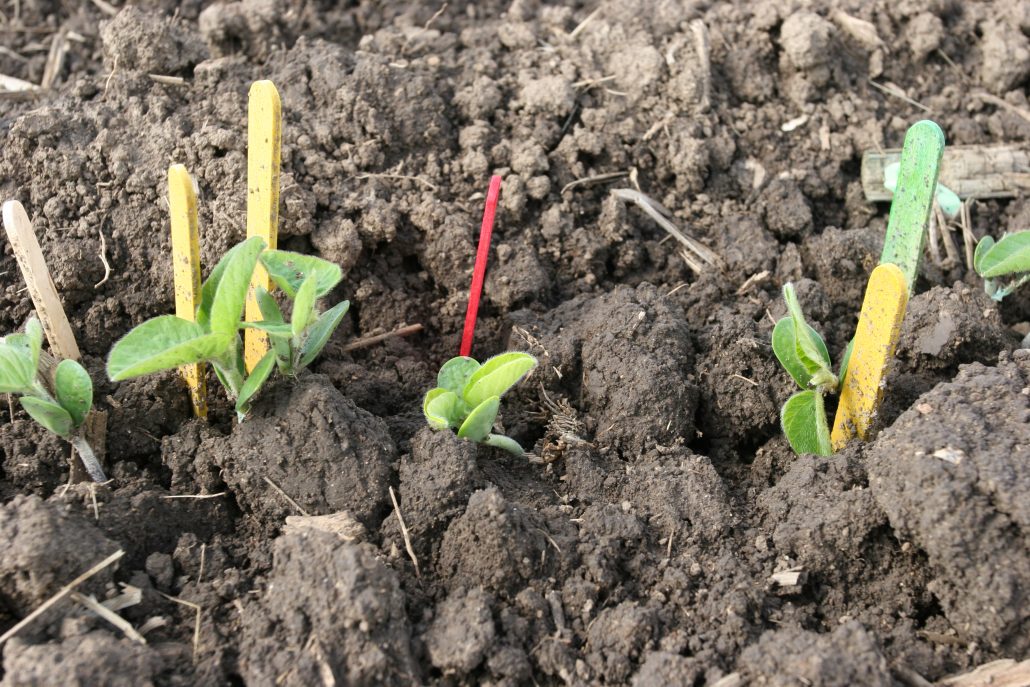
#Plant20 went by in a flash for many – but with a chilly past week across the Midwest, many are wondering how long will it take for early-planted soybean to emerge. To take a stab at this question, we pulled out some data from a 2008-2009 study that looked at impact of seed size and days to emergence on yield and quality of soybean (Mourtzinis et al., 2015). At the Arlington site for this study, emergence notes were done every day, and soil temperature probes were buried before planting. With this data, we can roughly assess the GDUs (Growing Degree Units) accumulated between planting and emergence for these two site-years. Before getting into the results, here is a little bit of housekeeping on how we calculate GDUs…
Calculating GDUs
Growing Degree Units (GDU), also called degree-days, or sometimes heat units, are used in crop growth models to estimate growth and development. There are some assumptions behind GDUs, most notably that the growth or process being predicted has a linear relationship with temperature (hotter = faster growth). This relationship only has to be true between the base (minimum) and maximum temperatures, which are typically thought of as 50°F and 86°F, since these are the values used for corn. These assumptions are true for corn growth – between 50°F and 86°F, corn grows and develops, passing through growth stages faster with more heat. This relationship is less studied for soybean (and less consistent due to soybean’s photosensitivity) but we generally use the same minimum and maximum temperatures when discussing GDUs in soybean. One possible change for soybean versus corn GDUs would be lowering the base temperature to 41°F (Setiyono et al., 2010). This increases the accumulated GDUs, especially early in the season (Fig 1). This is simply due to the way GDUs are calculated:
Daily GDU = {(Daily Minimum + Daily Maximum/2) – Base Temperature} (Campbell and Norman, 1998)
Accumulated GDUs from each day are then added together. If the daily average temp is below the base temperature (which is often true early in the season if using 50°F as a base), the GDU for that day is 0, not negative. It is important to note that the daily average temperature is calculated by taking the average of the recorded daily minimum and maximum, not the overall average temperature. These values are publicly available for many locations across the US (https://www.ncdc.noaa.gov/cdo-web/datatools/findstation), including the Arlington Ag Research Station.
A final assumption of using GDUs to predict growth is that the growing point of the plant is at air temperature. This is obviously not true before emergence! Strictly speaking, GDUs are designed to be calculated with air temperatures, not soil. Since we have data available for both – we used both!
Accumulated GDUs in 2008/2009
To start out, we calculated GDUs accumulated (with planting date as day 0: May 8th in 2008 and May 6th in 2009) for both years, from soil temperature, air temperature, and with two different base temperatures (41°F and 50°F). A few things can be taken away from this figure: it is obvious that using a lower base temp (blue lines) results in faster accumulation of GDUs – but we already knew this would happen. The reason it might be important for soybean would be the days where the average temperature is between 41°F and 50°F – base 50 counts these as 0 GDU’s. Since base 50°F is more widely used, we decided to present the emergence results with the higher base temperature, but we saw very similar results (just higher numbers) using 41°F. Clearly, more research needs to be done to determine a more accurate base temperature for soybean.
Outside of base temperature, this graph tells us some other things. First – it was warmer in 2009 (lighter shades of blue and orange). Second – GDUs calculated with soil temperature (solid lines) accumulate faster than with air temperature (dashed lines). Soil and air temperature are certainly linked, but soils tend to stay warmer at night, which drives up daily average temperature and daily GDU. Since pre-emerged soybeans are experiencing soil temperatures, but GDUs should be calculated with air temperature, the results are presented both ways.
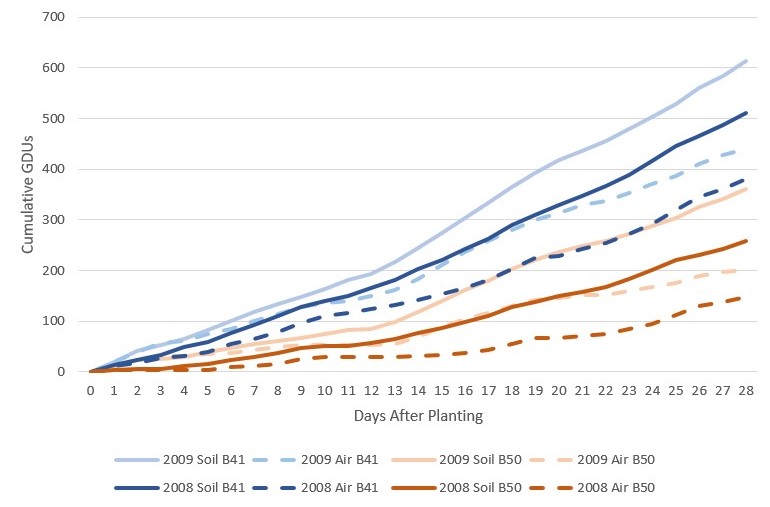
Fig 1. Accumulated growing degree units (GDUs) for 2008 (darker colors) and 2009 (lighter colors) at the Arlington Ag Research station, calculated with different base temperatures (blue = 41°F, orange = 50°F), with soil temperatures (solid lines) and air temperatures (dashed lines).
Results – GDUs to emergence was not consistent between years.
We used regression analysis to estimate the GDUs to emergence, which were greater in 2009 than in 2008 (Table 1, Fig 2). Growing degree units (GDUs) to 50% emergence, as calculated by air temperature, was estimated to be 57 in 2008, but 179 in 2009. Values for 90% emergence and GDUs calculated with soil temperatures are displayed in table 1. Similar results were noted across the 6 varieties of soybean included in the study, see table 3 at the end of the post for estimated GDU to emergence for each variety.
The increased number of GDUs accumulated before emergence in 2009 compared to 2008 is driven (mathematically, NOT biologically) by two main factors: heat and days to emergence. It was warmer in 2009, yet the beans actually took longer to emerge (Fig 3). Factors other than temperature, like planting depth, moisture, and other soil conditions likely have an impact on time to emergence. Rainfall in May in 2008 was about 3.1 inches total, and 3.5 inches in May 2009 (precipitation is also available at https://www.ncdc.noaa.gov/cdo-web/datatools/findstation) – so rainfall alone does not explain the delayed 2009 emergence compared to 2008.
Table 1. Estimated GDUs (Base 50°F) and days after planting to 50% or 90% emergence for 2008 and 2009, determined by regression analysis (see fig 2 for regression lines). Planting date in 2008 was May 8th, in 2009 it was May 6th.
|
2008 |
2009 |
|||
| % Emergence |
50% |
90% |
50% |
90% |
| Air GDU (°F) |
57 |
74 |
179 |
196 |
| Soil GDU (°F) |
129 |
157 |
309 |
343 |
| Days After Planting |
18 |
20 |
25 |
27 |
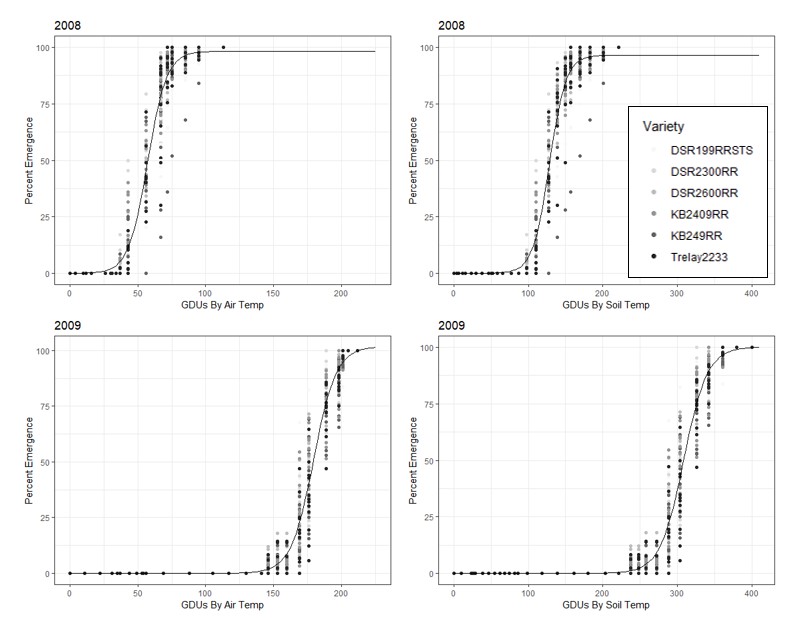
Fig 2. Percent emergence of soybean by growing degree units (GDU, Base 50°F) as calculated by air (left) or soil (right) temperature at the Arlington Ag Research station in 2008 (top) and 2009 (bottom). Points are shaded by variety. The black lines indicate the regression function determined for each set of points. Planting date in 2008 was May 8th, in 2009 it was May 6th.
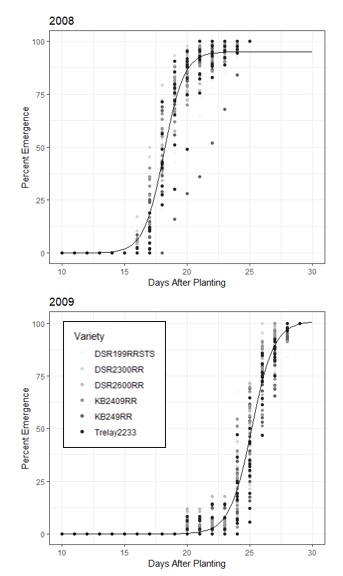
Fig 3. Percent emergence of soybean by days after planting at the Arlington Ag Research station in 2008 (top) and 2009 (bottom). Points are shaded by variety. The black lines indicate the regression function determined for each set of points. Planting date in 2008 was May 8th, in 2009 it was May 6th.
What does this mean for 2020?
Although it won’t perfectly predict your early-planted soybean emergence, all this GDU talk might have you interested in how many we have accumulated this year. Table 2 summarizes the GDUs accumulated since April 15th at the Arlington Ag Research Station. If you are interested in totaling these for your area, you just need daily minimum and maximum temperatures. Also, don’t count any accumulated GDUs from the day you planted – that is day 0. For those thinking about other crops – remember that the base temperature is crop specific! The base temperature for winter wheat, for example, is 37°F! (Campbell and Norman, 1998)
Overall, the data presented shows that we need more research to understand factors driving time to soybean emergence. The data indicates that GDUs are not a consistent predictor for soybean emergence, so other factors will likely need to be considered.
Table 2. Daily temperatures and GDUs accumulated at the Arlington Ag Research Station since April 15th.
| Date | T max (°F) | T min (°F) | T ave (°F) | GDUs (Base 50) | GDUs (Base 41) |
| 15-Apr-20 | 36 | 18 | 27 | 0 | 0 |
| 16-Apr-20 | 36 | 20 | 28 | 0 | 0 |
| 17-Apr-20 | 45 | 27 | 36 | 0 | 0 |
| 18-Apr-20 | 49 | 29 | 39 | 0 | 0 |
| 19-Apr-20 | 61 | 33 | 47 | 0 | 6 |
| 20-Apr-20 | 56 | 32 | 44 | 0 | 3 |
| 21-Apr-20 | 62 | 27 | 44.5 | 0 | 3.5 |
| 22-Apr-20 | 49 | 30 | 39.5 | 0 | 0 |
| 23-Apr-20 | 57 | 36 | 46.5 | 0 | 5.5 |
| 24-Apr-20 | 51 | 36 | 43.5 | 0 | 2.5 |
| 25-Apr-20 | 53 | 35 | 44 | 0 | 3 |
| 26-Apr-20 | 57 | 36 | 46.5 | 0 | 5.5 |
| 27-Apr-20 | 66 | 40 | 53 | 3 | 12 |
| 28-Apr-20 | 60 | 40 | 50 | 0 | 9 |
| 29-Apr-20 | 67 | 42 | 54.5 | 4.5 | 13.5 |
| 30-Apr-20 | 51 | 42 | 46.5 | 0 | 5.5 |
| 1-May-20 | 66 | 38 | 52 | 2 | 11 |
| 2-May-20 | 66 | 47 | 56.5 | 6.5 | 15.5 |
| 3-May-20 | 74 | 45 | 59.5 | 9.5 | 18.5 |
| 4-May-20 | 73 | 32 | 52.5 | 2.5 | 11.5 |
| 5-May-20 | 56 | 36 | 46 | 0 | 5 |
| 6-May-20 | 54 | 32 | 43 | 0 | 2 |
| 7-May-20 | 66 | 41 | 53.5 | 3.5 | 12.5 |
| 8-May-20 | 63 | 30 | 46.5 | 0 | 5.5 |
| 9-May-20 | 47 | 25 | 36 | 0 | 0 |
| 10-May-20 | 59 | 36 | 47.5 | 0 | 6.5 |
| 11-May-20 | 44 | 31 | 37.5 | 0 | 0 |
| 12-May-20 | 54 | 30 | 42 | 0 | 1 |
| Cumulative (April 15 until May 12) | 31.5 | 158 | |||
Table 3. Estimated GDUs and days after planting to 50% or 90% emergence for 2008 and 2009, for 6 different soybean varieties, estimated by regression analysis.
| Soil Temp GDUs to Emergence | Air Temp GDU’s to Emergence | ||||
| 2008 | Variety | 50% | 90% | 50% | 90% |
| DSR-199RR/STS | 133 | 166 | 60 | 78 | |
| DSR-2300RR | 122 | 147 | 53 | 68 | |
| DSR-2600RR | 130 | 156 | 58 | 74 | |
| KB2409RR | 126 | 154 | 56 | 72 | |
| KB249RR | 131 | 164 | 59 | 77 | |
| Trelay 2233 | 131 | 155 | 59 | 73 | |
| 2009 | DSR-199RR/STS | 306 | 343 | 177 | 196 |
| DSR-2300RR | 307 | 341 | 178 | 195 | |
| DSR-2600RR | 306 | 339 | 178 | 195 | |
| KB2409RR | 307 | 342 | 178 | 195 | |
| KB249RR | 313 | 349 | 181 | 199 | |
| Trelay 2233 | 313 | 344 | 182 | 197 | |
Literature Cited
Campbell, G.S., and J.M. Norman. 1998. An Introduction to Environmental Biophysics. 2nd ed. Springer.
Mourtzinis, S., J.M. Gaska, P. Pedersen, and S.P. Conley. 2015. Effect of seed mass and emergence delay on soybean yield and quality. Agron. J. 107(1): 181–186.
Setiyono, T.D., K.G. Cassman, J.E. Specht, A. Weiss, A. Dobermann, and H. Yang. 2010. SoySim User Manual. Univ. Nebraska-Lincoln Dep. Agron. Hortic. Inst. Agric. Nat. Resour.Available at https://soysim.unl.edu/soysim_manual.html.