A Tank Full of Sugar Helps the Profits Go Down

Adapted from original article written 6/1/2015.

Its been a struggle to get across our fields this year given all our precipitation. However I am sure there are “a plethora of opportunities” this year to to add sugar to your tanks to”perk that crop right up” so I thought I would dust off and re-post the below article originally entitled “Do Foliar Applications of Sugar Improve Soybean Yield”.

I also wanted to link to a few other articles from colleagues at the University of Nebraska “Sugar Applications to Crops – Nebraska On-Farm Research Network Results” and “Research Results: Sugar Applications to Crops“. In short the University of Nebraska team did not find a consistent yield increase in corn or sorghum and an 0.8 bu per acre yield increase in soybean. If farmers are considering a pass for just the sugar application, the average cost of ground application is $7.90 and aerial is $9.65 per acre; 2020 Iowa Farm Custom Rate Survey and the average yield loss caused by sprayer wheel track damage in soybean in rows less than 20 inches is 1.9 or 1.3% with a 90 or 120 foot boom, respectively.

I also want to give credit to my colleague Chad Lee who wrote a nice article entitled “Could Sugar Help Drought Stressed Corn?” that discusses sugar rates, biological activity and actual costs of product.

I am certain this re-posted article will stir up the same severe indignation as the original, however with November beans trading at $11.11 per bu locally today ROI is equally important under high commodity prices as it is low!

Do Foliar Applications of Sugar Improve Soybean Yield (Originally published: June 14th, 2011)

High commodity prices have led growers to consider many novel soybean inputs. One input that has garnered considerable attention is the foliar application of sugar products to increase soybean yield. The objective of this research was to evaluate soybean yield in response to various sources of foliar-applied sugar across four states in the Midwest. Field research studies were conducted at Arlington, Wisconsin; Urbana, Illinois; St. Paul, Minnesota; and West Lafayette, Indiana in 2010.The four sources of sugar evaluated in this study were:

  1. Granulated cane sugar
  2. High fructose corn syrup
  3. Molasses
  4. Blackstrap molasses.

All treatments were applied at the equivalent rate of 3 lb sugar a-1 and applied in 15 to 20 gal a-1 carrier. The treatments consisted of an untreated check, all four sources of sugar applied at V4, granulated cane sugar and blackstrap molasses applied at R1, granulated cane sugar applied at V4 and R1, and blackstrap molasses applied at V4 and R1.

No positive or negative (phytotoxic) effects were visually observed on the soybean foliage at any location within 10 days following foliar applications (data not shown). Furthermore, sugar did not increase soybean yield within location (data no shown) or across locations [P= 0.60 (Figure 1)], regardless of source. While this study cannot conclusively prove foliar applications of sugar will not increase soybean yield, the authors conclude that other management strategies to improve soybean yield should take precedence over applying sugar.


The source of this data is:

Furseth, B. J., Davis, V., Naeve, S., Casteel, S., and Conley, S. P. 2011. Soybean Seed Yield Was Not Influenced by Foliar Applications of Sugar. Crop Management. Accepted: 6/1/11.

Please visit: http://www.plantmanagementnetwork.org/sub/cm/brief/2011/sugar/ to view the entire manuscript.

Adjust Your Seeding Rate (Higher) But Not Your Maturity Group For Late May Planted Soybean

Adapted from original article written in 2018 by Authors: S.P.Conley, J.M Gaska, S. Mourtiznis, D. Mueller, and A. Varenhorst

With only 8 days left in May and roughly only 57% of the WI soybean crop planted what if any production changes should growers consider modifying?

  1. Do Not Switch Your Maturity Group….Yet: Do not consider switching to an earlier soybean maturity group until ~June 1. After June 1 do not go any earlier than a 0.5 MG earlier variety. For more information please see:  Soybean Planting Date and Maturity Group Considerations Moving into 2019.
  2. Increase your seeding rate to roughly 154,000 seeds per acre. Efficacy of soybean seed-applied fungicide and insecticide at early and late planting dates and a range of seeding rates were tested in multiple states during the 2016 and 2017 growing seasons. Researchers in Iowa, South Dakota, and Wisconsin participated with 4 locations each year for a total of 24 location/years.  Seed treatments included a) UTC, b) fungicide (prothioconazole, penflufen, and metalaxyl), and c) fungicide+insecticide (clothianidin). Only late planting dates were used in this below analysis. The average of the late planting dates for each state over the two years were: IA: May 24,  SD: June 21, and WI: May 31.  Seeding rates were in increments of 20,000 from 60,000 to 160,000 seeds/acre. There was a quadratic yield response to seeding rate that was significant (Figure 1). Maximum yield was observed at 154,000 seeds/acre. The curve is not very steep which shows that practical yield differences between seeding rates were not large. So, the curve does not tell the whole story. We re-ran the model with seeding rate as a categorical variable. The results suggest that yields for 140 and 160K were not different and 100-140K were not different either (Table 1). It may be argued that our seeding rate was not extended high enough…I assume my Twitter “friends” will come back and say “hey bean boy why didn’t you go to 180 or 220,000 seeds per acre”. That is a valid critique however given the flat response curve we find it difficult to believe we would have seen a significant yield response above where we are. As a reminder our recommended seeding rate for early planted soybean can be found here: Just the Facts Jack: Soybean Planting Date, Seeding Rate, Pre-Herbicide Timing, and Seed Treatment Recommendations .
  3. Interpret the below information on return above seed cost cautiously. The best part of writing in a blog format is that you get to tweak the post after it is originally published. To that point we had several comments last year on the the small yield response difference between seeding rates and question the optimal farmer return above seed cost. If you were to look only at that factor the optimal seeding rate would be ~100,000 seeds per acre even at a late May planting (Table 2). Though those economic numbers are very appealing I would caution growers to not go this low if they have uneven or rocky fields as harvestabilty will be a challenge with a lower soybean pod set. Furthermore many soybeans will be “planted” and I use that term loosely into unfavorable environments (wet and compacted soils) and emergence issues will be likely. I would also not go this low in fields that are prone to drought as the rows will be slower to canopy and lead to greater soil water evaporation and subsequent weed competition. This leads us to waterhemp and its wonderful biology of delayed germination and prolific seed set. The point I am trying to make is this is a system and as Paul Harvey so eloquently stated……”now for the rest of the story”!
  4. Figure 1. Soybean seed yield response to seeding rate for soybean planted in Late May and June in IA, WI, and SD.

Table 1. Mean soybean seed yield response to seeding rate for soybean planted in Late May and June in IA, WI, and SD.

Soybean seeding rate

(1000 seeds per acre)

Soybean Seed Yield

(bu per acre)

160 67.3 A
140 66.6 AB
120 66.0 B
100 65.8 B
80 63.8 C
60 61.6 D
Tukey-Kramer Least Squares Means (Alpha=0.05); LS-means with the same letter are not significantly different.

Table 2. Return above seed cost at various market prices for seeding rates over 60000 seeds/acre.

Seeding rate

Yield

Yield difference compared to 60000 seeds/a

Soybean market price ($/bu)

10.00

11.00

12.00

13.00

14.00

seeds/a

bu/a

—–bu/a—–

——– ——– $/acre —————

60000

61.6

Base

80000

63.8

2.2

12.70 14.90 17.10 19.30 21.50
100000

65.8

4.2

23.40 27.60 31.80 36.00 40.20
120000

66.0

4.4

16.10 20.50 24.90 29.30 33.70
140000

66.6

5.0

12.90 17.90 22.90 27.90 32.90
160000

67.3

5.7

10.60 16.30 22.00 27.7 33.40
Based on $65.00/140000 seeds

Soybean Replant Decisions Made Easy(ish)!

This past Monday, I received a text from a southern Wisconsin farmer (he asked for anonymity) sharing crop progress numbers from an agricultural consulting group (I don’t advertise for free, LOL). They reported that soybean planting was 4% ahead of average, while corn planting was 3% down. Interestingly, the farmer suggested that our recommendations, based on research funded by the Wisconsin Soybean Marketing Board (WSMB) and the North Central Soybean Research Program (NCSRP), advocating for early-planted soybeans, might be responsible for this difference! I’ll gladly take that blame!

Since that text, X (formerly known as Twitter) has been erupting with widespread images of soybeans beginning to crack and emerge. As farmers, agronomists and technical service providers begin to assess their 2024 soybean stands, below are a few factors our Science For Success team have compiled to help make any replant decision as easy as possible!For more detailed information regarding the factors above please see our full resource guide entitled: Soybean Plant Stands: Is Replanting Necessary?

For specific WI recommendations please see below!

  1. Get an accurate stand assessment. We are often drawn to the worst areas of fields and over-blow how bad the overall stand really is. You can go old school and use the tape or hula-hoop method or try a digital approach such as Bean Cam the WSMB funded soybean replant app!
    1. Link to the app store for iPhone and iPad
    2. Link to the app store for Android

      Bean Cam app calculations/results.

  2. An effective stand is obviously important to maximize soybean seed yield. However the downside yield risk for a sub-par stand is minimal until stands fall below 50,000 plants per acre. The synergy of early planting coupled with breeders adding 3x yield to soybean branches at low populations have effectively reduced the yield penalty for thins stands by 1/2 (Suhre et al. 2014) . Therefore we recommend the following.
    • Early planted soybean yield is maximized with stands that range from 100,000 (high yield environment) to 135,000+ (low yield environment) plants per acre.
    • When soybean stands are less than 50,000k plants per acre, inter-plant new seed with a similar maturity into the existing stand. DO NOT TEAR UP THE STAND AND START OVER.
    • When stands fall between optimal and 50,000k plants per acre Think Twice Before Replanting Soybeans! Our data shows a nominal ~2 bu yield increase in this situation. Even if you have a “free replant” guarantee the numbers don’t make economic sense. As a grower you are better off investing $$$ in an effective in-season residual herbicide to control weeds such as Palmer and waterhemp.

References:

Gaspar, A. and S.P. Conley. 2015. Responses of canopy reflectance, light interception and soybean seed yield to replanting sub-optimum stands. Crop Sci.55: 377-385. doi: 10.2135/cropsci2014.03.0200

Suhre, J.J., Weidenbenner, N., ‡Rowntree, S., Wilson, E., S., Naeve, S. Casteel, S.P. Conley, Diers, B., Esker, P., Specht, J., and Davis, V. 2014. Soybean Yield Partitioning Changes Revealed by Genetic Gain and Seeding Rate Interactions. Agron. J. 106:1631–1642.

Keep your cocktails for happy hour: the perils of complex tank mixing!

Shawn P. Conley, Jed Colquhoun, and Damon Smith; UW Madison Professors and State Extension Specialists

#Plant24 is “On Like Donkey Kong” so we thought it would be a good to remind growers to keep your cocktails for happy hour and consider the perils of complex tank mixing!

Adding something “extra” to the spray tank is not a new or novel phenomenon in agriculture; however, in today’s economic, social, and regulatory environment it is in agriculture’s best interest to think twice before blindly adhering to this mentality. Dr. Paul Mitchell, UW Ag Economist and Associate Dean, terms this practice “the more-on principle”. In its simplest form, this principle is founded on the belief that the more I put on the less downside risk my operation will be exposed to. This “more-on principle” is usually sold as or purchased under the guise of “cheap insurance” for farmers. What makes this principle more appealing is that the extra input is often priced in the 0.5 to 1 bu price for soybean or 2-3 bu price of corn. It is usually conveniently priced so a researcher, farmer, or crop consultant can’t effectively measure if the product paid for itself or not. Not surprising to anyone, these one-off products are internally referred to as profit centers.

The “more-on principle” is risky enough as a one-off addition to a tank-mix, but we are now starting to see multiple products added to the tank. Without further investigation, the farmer may not know what they are applying. To make it worse, the products are often applied at rates that are ineffective. To frame this more explicitly, a common practice this summer in field corn was to offer a farmer a tank-mix that included a fully loaded fungicide, an insecticide (in absence of any insect pests), a foliar feed product, (in the absence of any nutrient deficiency and at fertilizer rates that are known to be ineffective), and additional adjuvant (because it is a well know profit center) at a cost of ~$50 per acre. We won’t even broach the soybean programs containing fully loaded fungicides, insecticides, micronutrient packs, biologicals, and sugar components or the specialty crops where 8-way mixes aren’t uncommon!

So what damage is the “more-on principle” bringing to the ag sector? The first negative hit to a farmer is economic. The custom suite of products is often sold to the farmer as a program. The farmer is expected to either buy the entire program as is or they must wait until the end of the spray cycle to get their off-program applications. It is also difficult to verify if the program worked because often there isn’t a yield-check strip. This challenge is further confounded with genetic yield-gain in most crops, that regardless of inputs, will lead to increased yield over last. So, the real question is ‘did this suite of practices really work?’ To be frank, probably not. For example, we tested the hypothesis that high-input soybean systems provide greater yield and economic stability to farmers. What we found was that intensive management input systems minimally reduced the average cost of yield risk (<3% of average yield) and did not consistently protect soybean yield from downside yield risk, which is counter to what the “more-on principle” would say. See more here!

The next downside peril is increased risk of pesticide resistance. In the example above, an insecticide was added to the tank-mix in the absence of a known insect threshold/pest issue. This not only increases selection pressure for insecticide resistance but also damages the beneficial insect population. The use of insecticide in this case makes the problem worse! We also see this with the use of fungicides, where inappropriate product choices have been used because they were “cheap insurance.” While this sounds good, using the wrong product can make a disease worse. Growers should know what is being sprayed and be sure that the product has been verified to be effective for the target you are after.

In the above scenario we also run the risk of decreased pesticide efficacy due to potential compatibility issues. Not only does this lead to decreased pesticide efficacy and increased resistance issues, but it also can result in registrants’ walking away from issues due to incompatibility issues. In some cases, complex, untested multi-product tank mixes can sometimes even cause crop injury or malformed development.  For example, we’ve seen cases in cranberries where a new and unknown adjuvant in an herbicide mix fused the cranberry blossoms to the point where they couldn’t be pollinated and didn’t produce a crop.

Lastly and even scarier is the increased risk of metabolic resistance, where pesticide applications can ramp up general enzymes in pests that “digest” subsequent applications such that they’re ineffective. This is a scary deal check it out here! The cherry on top of this story of peril is that the pesticide pipeline is very slim. The path to new pesticides, especially novel classes of active ingredients, is nearly non-existent. Also coming along are possible new regulations regarding the Endangered Species Act and agricultural pesticide use. While still open for public comment and potential revisions, there are regulations being considered that will heavily restrict the use of pesticides especially near water and where endangered species are known to exist. Careless use of pesticide applications as described above merely adds to the reasoning to further restrict pesticide use in agriculture.

Finally, it’s important to consider the greater social implications. In agriculture we often pat ourselves on the back and tell everyone we are sustainable and are feeding the world. We can do, and be, better when it comes to using research-based decision making to use inputs only when and where they’re warranted and effective.

If you are a farmer and you wish to explore alternative inputs and complex tank mixes, we are not entirely against this practice, but suggest considering the following before you pull the input trigger.

  1. Know what you are buying (know the active ingredient and don’t let sellers get away with the excuse that it is proprietary). For pesticides, remember that the label is the law with use directions that need to be followed and often dictate tank mix options.
  2. Know the mechanism of action (i.e. what is the input going to do, and is that a verified issue for your crop situation?).
  3. Have independent data showing yield results and efficacy, not just the pretty sales brochure from the company showing huge yield differences with no statistics.
  4. Work with your regional educator, crop consultant or CCA and leave a check strip to see for yourself under your management techniques. Observe the treated area compared to the check strip for pest control, crop development and any potential crop injury.  Tank mixes can sometimes be synergistic and result in crop injury or antagonistic in ways that reduce target pest control.  Most complex tank mixes with several products haven’t been tested extensively.

Though this quote wasn’t meant for this application we think it is definitely apropos: “Protectionism is the Institutionalization of Economic Failure” – Edward Heath

The WSMB Free Soybean Cyst Nematode Testing Program is Back in 2024!

Damon Smith and Shawn P. Conley

The WI Soybean Marketing Board (WSMB) sponsors free nematode testing to help producers stay ahead of the most important nematode pest of soybean, the soybean cyst nematode (SCN). Eggs of SCN persist in the soil between soybean crops so a sample can be submitted any time that is convenient. The soil test report indicates the number of eggs in the sample and is useful for selecting the right variety for the next soybean crop. Retests of fields planted with SCN-resistant varieties over multiple years shows how the nematode population is responding to variety resistance and provides an early warning should the nematode population adapt to host genetics.

In the spring of 2012, the WSMB expanded the nematode testing program to include other pest nematodes in addition to SCN. These nematodes are less damaging to soybean than SCN but can cause enough yield loss to warrant treatment. As is the case for SCN, there are no rescue treatments for nematodes so the primary purpose of this year’s soil test is to plan for next year’s crop. Soil samples collected in corn for nematode analysis have predictive value for explaining yield if they are collected before the corn V6 growth stage. Sampling early in the season will provide information about the risk potential for the current corn crop AND the next soybean crop.

The assays used to recover nematode pests other than SCN in soil require that the nematodes are alive. So, it is important to keep the samples moist and at least room temperature cool. Collecting a sample that includes multiple cores ensures that there will be plenty of root pieces to assay. It is not necessary to include live plants in the sample. The soil test report will indicate which pest nematodes are present and at what quantities and their damage potential to soybean and corn based on the numbers recovered.

For more information on SCN testing and management practices or to request a free soil sample test kits please contact: Jillene Fisch at (freescntest@mailplus.wisc.edu).

Click to view more information on our WI SCN testing program or visit The SCN Coalition.

Remember the first step in fixing a nematode problem is to know if you have one! The WSMB sponsored nematode testing program provides you that opportunity. So Wisconsin farmers….”What’s you number?”

Just the Facts Jack: Soybean Planting Date, Seeding Rate, Pre-Herbicide Timing, and Seed Treatment Recommendations

Blog article updated 4/3/2024 with pre-emergence herbicide information from Dr. Werle and Guilherme Chudzik added as authors.

When I am asked a direct question from a farmer or a crop consultant my response is always as follows…Do you want the short answer or the long answer as I can say the same thing in 5 minutes or 5 hours. Their response to me is almost always the same…”Just the Facts Jack”. In this blog I will attempt to answer four very agronomically important and challenging questions in a very succinct manner.  However as we all know brevity can be a gift or a curse depending upon the context of the question. With that being said here we go!

Question #1. When should I start planting soybean? My general response is to start planting your soybean crop ~7 to 10 days before you start putting your corn in the ground with the caveat that the soil is fit and you are following your crop insurance replant dates (Please review updated RMA map). We have measured soybean yield loss due to delayed planting date as early as ~April 10th in parts of the Midwest however the rapid yield decline (up to 0.5+ bpa per day) occurs at ~May 10th. As you would expect the magnitude of this planting date yield response is soil and climate dependent and yield losses in some areas (TED’s) where as high as 2.8 bpa per week for delayed planting (Figures 1 and 2). For a deeper dig please review the below supplemental documents.

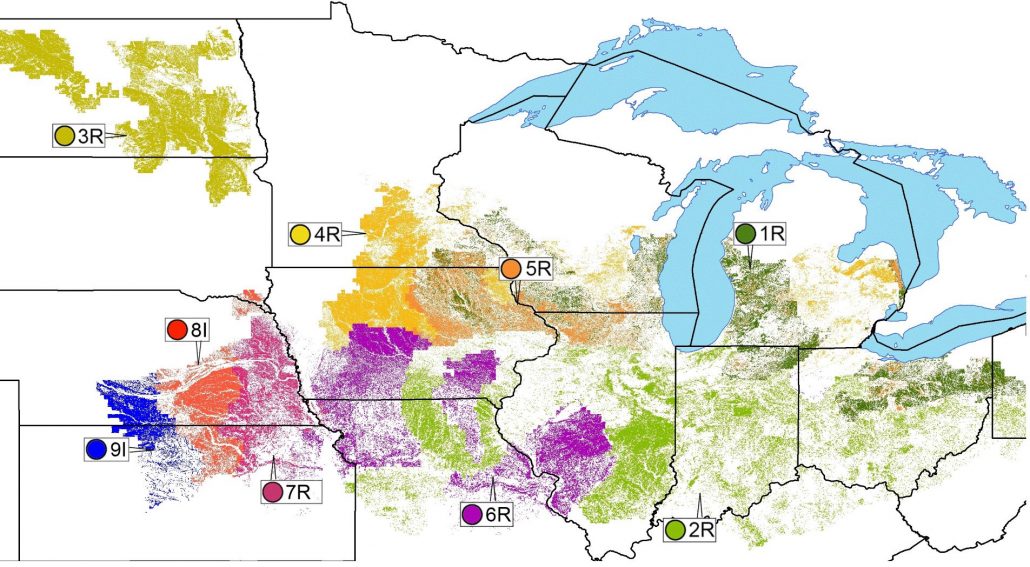
Figure 1. Map of the North Central US region showing nine technology extrapolation domains (TEDs) used in this analysis.

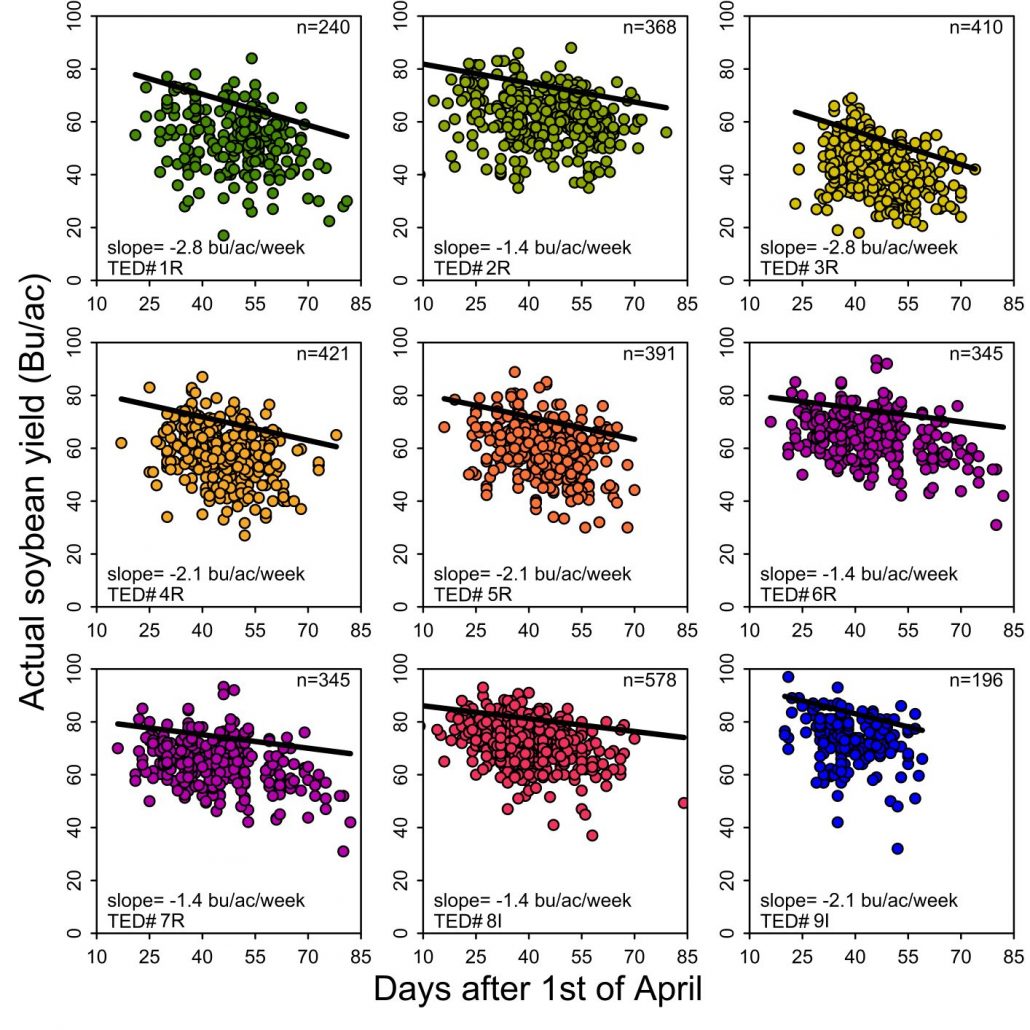
Figure 2. Producer soybean yield plotted against planting date in 9 technology extrapolation domains (TED) in the NC USA region.

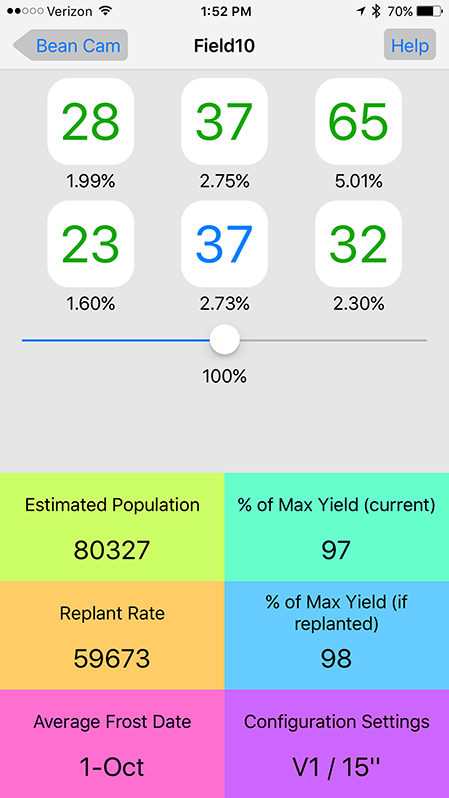
Question #2. What is the optimal soybean seeding rate? The quest for the optimal agronomic soybean seeding rate for yield vs. the optimal economic seeding rate has been an ongoing debate. Fortunately a large group of academics and industry (thank you Corteva) were able to combine data sets and address this question (Figure 3). Our results suggest that for “on-time” soybean planting dates the optimal agronomic soybean seeding rate to achieve 99% yield potential ranged from 237,000 to 128,000 seeds per acre (assuming 90% germ) across environments; whereas the optimal economic soybean seeding rate ranged from 157,000 to 103,000 seeds per acre. Thankfully this roughly confirms my original recommendation that you buy a bag an acre (140K) and place ~20% more seed on the low yielding acres and ~20% less on the high yielding acres, especially in areas of high white mold concern. If planting is delayed however we do recommend that you increase your seeding rate accordingly (Adjust Your Seeding Rate (Higher) But Not Your Maturity Group For Late May Planted Soybean ). For a deeper dig please review the below supplemental document.

 Location of 211 trial site-years that are included in the database and their respective environmental cluster classifications.

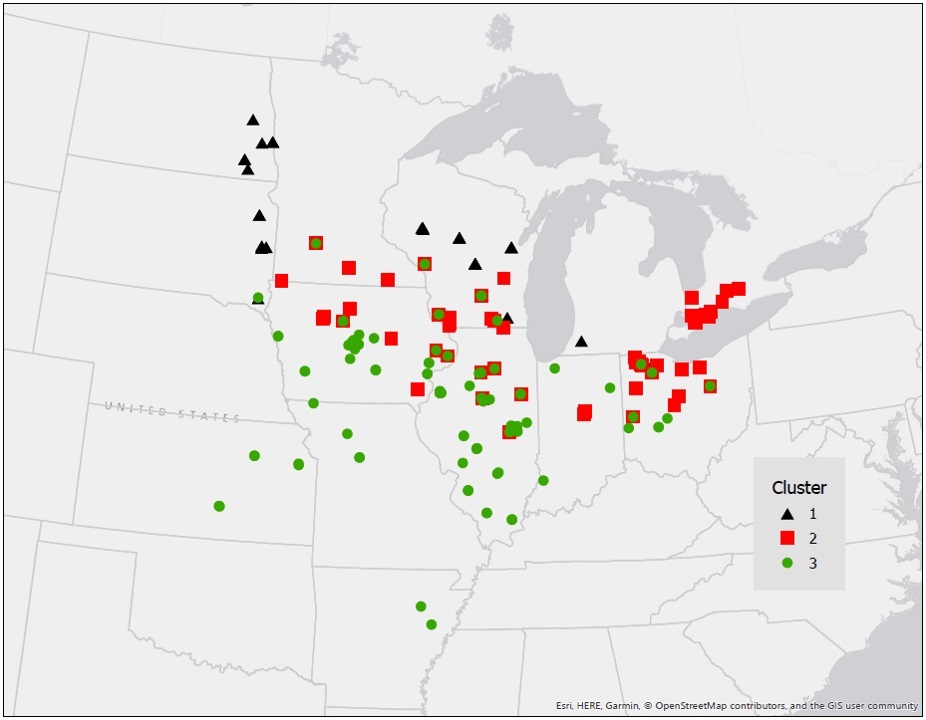
Figure 3. Location of 211 trial site-years that are included in the database and their respective environmental cluster classifications.

Table 1. Agronomic and Economic Optimal Soybean Seeding Rates by Environmental Cluster.

Cluster 1

Cluster 2

Cluster 3

Yield level (bu a-1)

Agronomic/(Economic) Optimal Seeding Rate1,2

< 58

237/(133)

170/(136)

130/(103)

58 – 71

168/(138)

145/(157)

136/(121)

> 72

154/(119)

128/(122)

142/(145)

1Agronomic optimal seeding rate (x1000 seeds) based on 99% maximum yield level.

2Economic analysis based on $62 a unit (140k) for seed and $9 a bushel pricing; soybean price and seed cost fluctuations will change the EOSR.

Question #3. When should I apply my pre herbicide?

The effectiveness of PRE-emergence herbicides is influenced by many factors including application time, soil type, weather conditions, and weed seedbank community composition and infestation level. The ideal time to apply a PRE herbicide is shortly before the onset of emergence of the target weed species followed by 1-2 inches of activating rainfall. But that’s often not the reality under field conditions.

For soybean planted in May, applying a pre-emergence herbicide at or shortly after crop planting is a standard practice and makes agronomic sense. Deciding when to deliver a pre-emergence herbicide to ultra-early planted soybean can be challenging though. One of the challenges is that some of the effective PRE herbicides for waterhemp control should be applied within 3 days of soybean planting according to their labels (e.g., flumioxazin, sulfentrazone). If soybean is planted in mid-April, and waterhemp doesn’t start emerging until mid/late-May, should a PRE still be sprayed in April within 3 days of planting? Or should a grower decide on a more flexible chemical program that allows for a later application?

Our recent research funded by the Wisconsin Soybean Marketing Board indicates that, in lighter soil (e.g., sandy loam, 1.6% O.M), residual herbicides dissipated faster compared to in silt loam soil (e.g., silt loam soil, 3.5% O.M). Moreover, herbicide dissipation was faster during the wetter spring of 2022 compared to the dry spring of 2023. What these results suggest is that applying PRE herbicides early, particularly in fields with lighter soils during wet years, may result in poor control of late-emerging weeds such as waterhemp and small-seeded annual grasses (e.g., foxtail species).

  • Factors like soil type, weather conditions, and weed seedbank community composition and infestation level impact the effectiveness of PRE herbicides.
  • Timing PRE herbicide applications is crucial for successful weed control, particularly in ultra-early soybeans.
  • In lighter soils, residual herbicides dissipate faster, thus application timing becomes critical to avoid reduced control and the need for multiple sprays to control late-emerging weeds, particularly during wet years.

Question #4. When do I use a soybean seed treatment? I purposely placed this questions last as I know it will draw significant ire; however the data are what they are. Soybean seed treatments should only be used in some early planted soybean situations and/or if you have a history of or have scouted for an insect (i.e. Bean leaf beetle) or a pathogen (i.e. SDS) that exceeds economic thresholds. For a deeper dig please review the below supplemental document.

Th-th-th-that’s all folks!
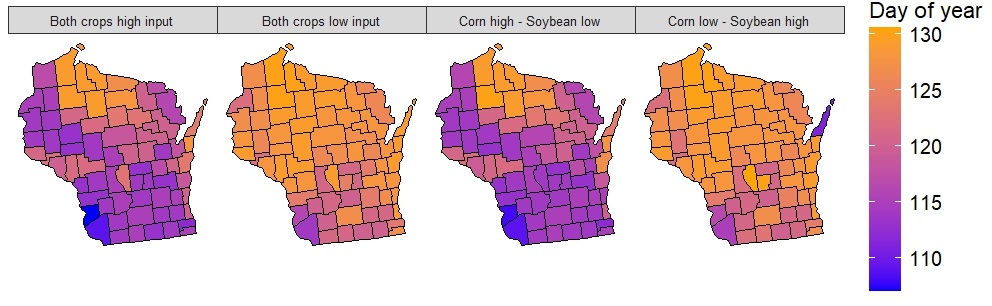
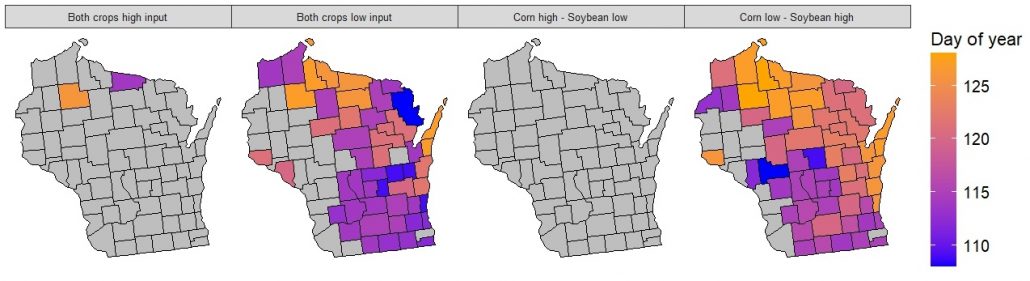
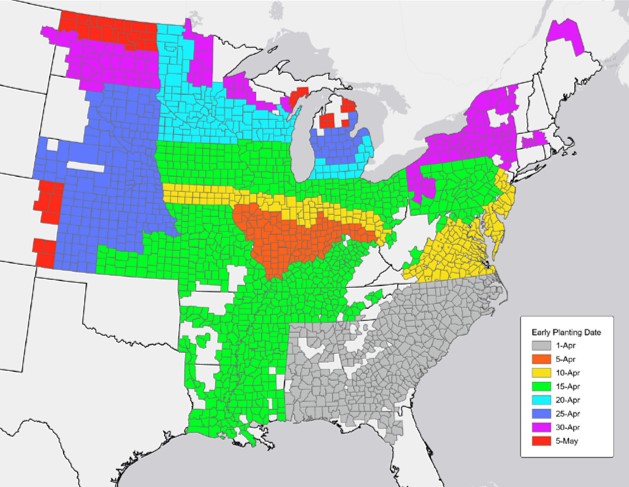
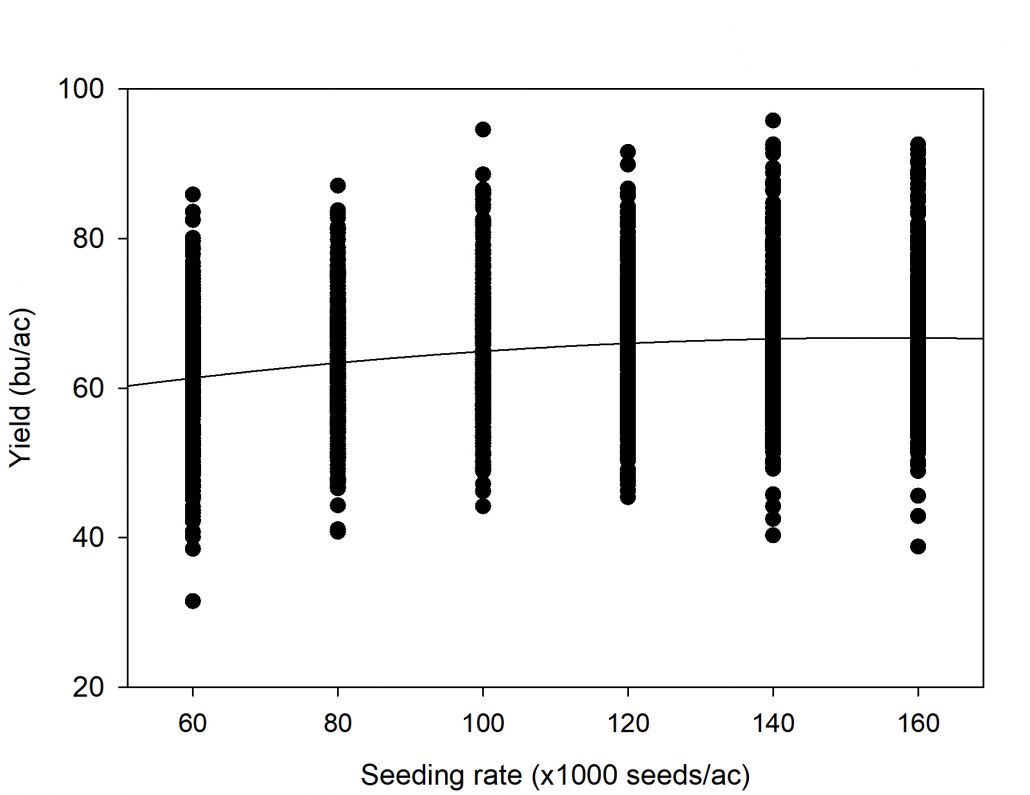
Where in the Deuce Did this Soybean Yield Come From?

Shawn Conley, Spyros Mourtzinis, John Gaska and Adam Roth: UW Madison; Anibal Cerrudo and Seth Naeve: University of Minnesota

Entering the soybean harvest of 2023, numerous Wisconsin soybean farmers were concerned about prolonged dry periods affecting the growing season and potentially resulting in significantly reduced soybean yields. Despite an overall state average yield decrease of 7.4% from 2022 (54 bpa), most farmers were pleasantly surprised with their farm production. The state average of 51 bpa in 2023 matched the previous 5-year average (Image 1). Several key factors contributed to averting a soybean yield disaster in 2023.

Image 1. Soybean yield data from our variety trials

Image 1. Soybean yield data from our variety trials

  1. Planting date optimization: Encouraging farmers to be aggressive yet sensible and push their soybean planting dates has been an effective strategy for maximizing soybean yield across the Midwest. Here are some key resources to hammer home this point.
    1. Analyzing more than two decades of Wisconsin soybean planting progress (2000-2022)
    2. Just the Facts Jack: Soybean Planting Date, Seeding Rate and Seed Treatment Recommendations
    3. The Best Soybean Planting Date
  2. Soil moisture at planting: Farmers in Wisconsin were very fortunate (compared to neighboring states) that our root soil was wetter than normal suggesting that our soil water profile was in good to excellent condition going into the growing season (Image 2). This fact coupled with our moderate to high soil water holding capacity that usually ranges from 4 to 12 inches in most parts of the state (Image 3) suggests our soybean crop would be resilient to an early to mid-season drought. Remember the average soybean crop needs ~20-26 inches of water.
    Image 2. Root Zone Soil Moisture Map May 1 2023.

    Image 2. Root Zone Soil Moisture Map May 1 2023.

    Image 3. Soil water holding capacity

    Image 3. Soil water holding capacity

  3. Low but timely rainfall: Across most of the state, drought intensified during the 2023 growing season as shown in figure 4. However, many parts of the state did receive timely rainfall in July, August and September that maybe were not reflected in the drought map but were captured in our modeling effort described below. Anibal Cerrudo at UMN using the DSSAT CropGro Soybean Mechanistic Model was able to capture yield response to our 2022 and 2023 weather conditions and helped to understand where these soybean yields came from.

    Image 4. WI Drought Map 2023

    Image 4. WI Drought Map 2023

To get started here are definitions for modeling parameters that help explain the following figures.

  • Potential yield (Yp): yield under no water limitation (maximum yield that can be achieved in theory).
  • Rainfed 100%sw: yield under rainfed conditions with 100% available water in the soil at planting.
  • Rainfed 50%sw: yield under rainfed conditions with 50% available water in the soil at planting.
  • Red dots: 90% of maximum yield data from various UW experiments (for comparison purposes).

For Arlington, with a notable soil water storage capacity (280 mm (11 inches) up to 5 feet depth; Image 3), when planting in a fully charged soil we should not expect water stress under the rainfed conditions we experienced in 2022 and 2023. The highest yield data from the experiment (red dots) are close to these predictions in both years (Image 5). If farmers had planted, and the soil water holding capacity was at 50%, given the rainfall patterns observed in 2023, we would have anticipated a yield depression of approximately 10 bpa under the 2023 weather conditions, which received only 266 mm of rain during the growing cycle from May 1st to October 1st (compared to the 502 mm of rain received during the 2022 growing cycle).

Image 5. Simulated yield data at our Arlington location

Image 5. Simulated yield data at our Arlington location

For Clinton, with a lower soil water holding capacity (185mm or 7.5 inches up to 5 feet depth; see Image 3), there were no differences between Yp and Yw for 2022 when the rainfall input was 462 mm (May 1st to October 1st; see Image 6). However, in 2023, with a reduced rainfall input of only 335mm (May 1st to October 1st), even when planting in a fully charged soil, we should anticipate water stress and potential yield loss. In instances of water stress, the model indicated a significant window with no impact on planting date, as water limitation played a more crucial role in yield reduction than solar radiation and temperature.

Image 6. Simulated yield from our Clinton location

Image 6. Simulated yield from our Clinton location

The key points from this article to remember are as follows:

  1. Continue to push and optimize your soybean planting date. Though this does not guarantee maximum yield, it sets you up for maximum yield.
  2. A full water profile going into the growing season is a huge savior.
  3. Early season drought doesn’t define our growing season.
  4. Our modeling efforts showed that our relatively good soil profiles along with timely rainfall in July, August and early September really saved our bottom line.

Know Before You Sow!

Background on Notice to Trade:

On March 6, 2023, USDA-AMS published a report titled “More and Better Choices for Farmers: Promoting Fair Competition and Innovation in Seeds and Other Agricultural Inputs.” This report was a response to Executive Order 14036, which directs federal agencies to take action to promote competition across the American economy. It outlines strategies for ensuring that the intellectual property system, while incentivizing innovation, does not unfairly restrict competition.

During the process of collecting public comments, holding listening sessions, and conducting meetings with farmers, plant breeders, industry experts, and seed companies, concerns were raised regarding the lack of important information available to seed purchasers through advertisements and catalogs.

The report found that withholding crucial details, such as variety names, before delivery can constrain competition and hinder innovation in several ways:

  • Marketing a plant variety under different brand names without disclosing the variety name makes it difficult for consumers to determine which IP rights pertain to a variety.
  • Withholding variety names from advertising can lead to price discrimination and prevent brands selling the same variety from competing based on other factors like price, seed quality, and customer service.
  • Lack of varietal information in advertising also complicates farmers’ strategies to manage on-farm diversity and mitigate risk by planting multiple varieties of the same crop.

As a response to these concerns, USDA published a notice to trade, which underscored that farmers and other businesses should know the kind and variety of the seed that they are purchasing. AMS expects purchasers to be informed of kind and variety at the earliest opportunity, usually at the time of purchase and no later than the commencement of shipment. Sellers may achieve this by allowing the grower to physically review the seed container and its label prior to shipment, by making the labeled claims easily accessible to the grower (e.g., a link to an image of the actual label), or through other appropriate means. The notice to trade aims to ensure that growers have the necessary information to make reasoned and well-informed purchasing decisions. This, in turn, fosters transparency and promotes fairer competition in agricultural input markets.

For additional information, feedback and questions, please visit the Seed Liaison Website www.ams.usda.gov/rules-regulations/seed-liaison or contact the USDA Seed Liaison Initiative at seedliaison@usda.gov. For information on how to file a complaint under the Federal Seed Act, please visit the Federal Seed Act website at www.ams.usda.gov/rules-regulations/fsa/complaints or email seedcomplaints@usda.gov.

Main points for farmers:

  • You should have access to the variety name of the seed you are purchasing when the seed is shipped, and usually at the point when you make purchasing decisions.
  • This is so you can make decisions about what to plant on your farm, with all the relevant information needed to choose the best seed and supplier for your situation.

Winners of the 2023 WI Soybean Yield Contest

Division 1:

1st           Todd Poeschel, Buffalo County (88.46 bu/a with Pioneer P18A73E)

2nd          Justin Sarauer, Chippewa County (77.66 bu/a with Pioneer P13T47E)

Division 2:

1st           Jim Salentine, Kewaunee County (81.85 bu/a with Stine 19EC12)

2nd          Nick Fitzgerald, Manitowoc County (78.44 bu/a with NK 14-W6E3)

Division 3:

1st           Don and Doug Midthun, Dane County (107.45 bu/a with Asgrow AG24FX1)

2nd          Nick Venable, Rock County (93.76 bu/a with Jung 1244XF)

  • *UW Bean Team (Mark Kendall, Andrew Malcomson, Haleigh Ortmeier-Clarke, Tatiane Severo Silva), Columbia County (90.97 bu/a with Dyna-Gro S21EN81). The UW Bean Team attained the 3rd highest yield in Division 3. The UW Bean Team consists of graduate students and postdocs of Dr. Conley who make all agronomic decisions for their entry.

Division 4: 

1st           Tom Evenstad, Lafayette County (97.27 bu/a with Dyna-Gro S29EN62)

2nd          Jason Weigel, Grant County (95.64 bu/a with Beck’s 2830E3)

New Contestant Award

  • Dan Kamps, Lafayette County (92.86 bu/a with Xitavo XO 2832E)

Planting Green Award

  • Dennis Roche, Dodge County (77.82 bu/a with CROPLAN CP1721E)

The contest is sponsored by the WI Soybean Program and organized to encourage the development of new and innovative management practices and to show the importance of using sound cultural practices in WI soybean production.

For more information please contact Shawn Conley, WI State Soybean Specialist at 608-800-7056 or spconley@wisc.edu