Authors: Tatiane Severo Silva, Spyros Mourtzinis, James Specht (UNL), Shawn P. Conley
In a bean pod:
- Twenty-two out of the past 23 years, the 50% WI soybean planting progress date was attained between May 13 to May 30.
- A one-day delay in the 23-year Wisconsin soybean 50% progress date was related with 0.45 bu/ac yield decrease.
- The 23-year historic average date for Wisconsin soybean 50% planting progress was May 24th.
- Wisconsin soybean growers who reached the 50% progress date 11-days earlier than the 23-year average of May 24 would have potentially gained 3.6 bu/ac in yield.
Introduction
USDA-NASS has reported Wisconsin soybean planting progress on a weekly basis since 2000. Full-text reports for the 23 past years (2000-2022) are available here. Here, we explore the Wisconsin historical soybean planting progress data and provide insights into trends in planting dates and their effects on yields. According to recent UW-Madison research, soybean yield is likely to increase when planted earlier in the season (see here and here). This article seeks to explore whether Wisconsin soybean growers have been shifting their planting dates forward over the course of more than two decades, and how this trend might affect potential yield. We provide an analytical overview of soybean planting progress in Wisconsin, along with the possible yield effects.
NASS Weekly Wisconsin Soybean Planting Progress (Example Remarkable Past Years)
Figure 1 shows weekly estimates of Wisconsin soybean planting progress (represented by solid dots) from NASS for four notable years in the past (2004 = red, 2012 = black, 2019 = green, and 2021 = blue). Planting progress was modeled by the Logistic Equation (illustrated in the figure text boxes) with Sigmoid (S-shaped) curve, which illustrates planting progress across WI from the start (0%) to the end (100%). The sigmoid curves illustrated in Figures 1 and 2 characterize the slow initial progress of planting that gradually picks up pace until it reaches a midway point of 50% progress (represented by a thick black horizontal line), and then slows down as it nears completion.
Using the equation, we computed the Logistic Xm value for each curve, which represents the specific spring date when the planting progress reached 50%. The vertical lines in different colors in the figure indicate the Day of Year (bottom axis) and Month-Day (top axis). In addition, we computed a Logistic k rate value for each curve, which is a numerical measure of the pace at which planting progress took place. The greater the Logistic k rate, the more rapid the ascent of the curve (e.g., 2012 curve [k = 0.20]), indicating rapid planting progress, while a slower k rate generates a flatter curve (e.g., 2004 curve [k = 0.09]). The shaded area characterizes the 95% confidence interval (CI) for the regression planting progress error estimation.
The four curves depicted in Figure 1 correspond to the most rapid (black line), slowest (red line), earliest (blue line), and latest (green line) soybean planting progress data observed over the 23-year period to date. For instance, the earliest 50% of soybean progress was attained in 2021 (May 13), whereas the latest 50% date was attained in 2019 (Jun 6). The 50% soybean progress in 2021 outpaced that of 2019 by 23 days.
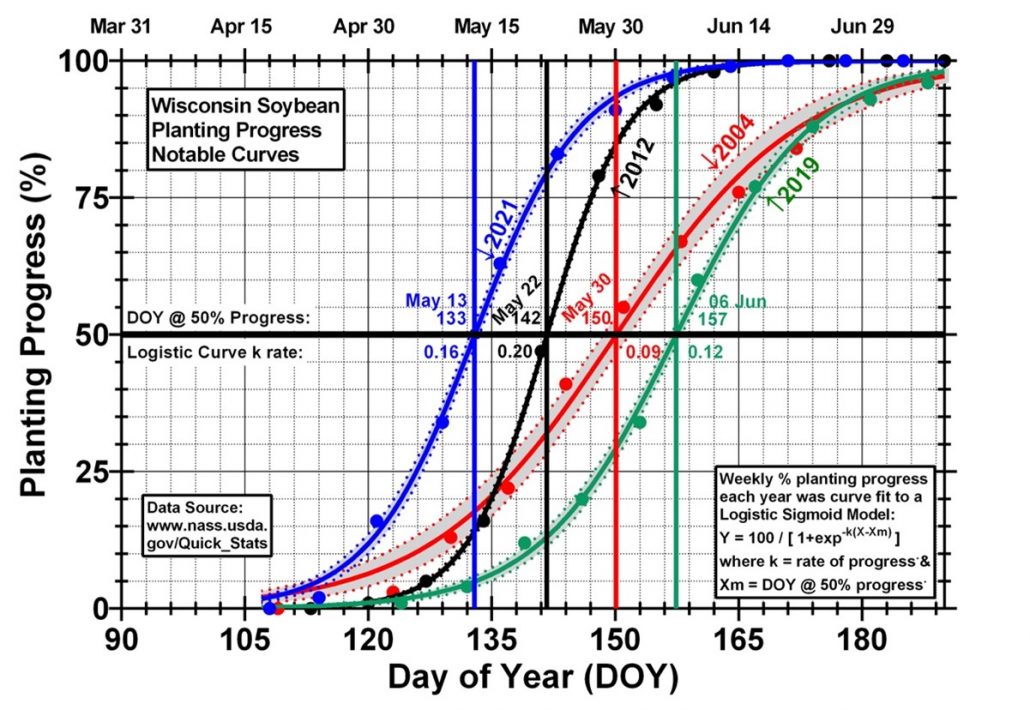 Figure 1. Notable example years (2004, 2012, 2019, and 2021) of soybean planting progress in Wisconsin.
NASS Weekly Wisconsin Soybean Planting Progress (2000-2022)
Figure 2 shows all 23-years sigmoid curves generated from the extracted NASS soybean weekly planting progress report data. The colored S-shaped curves in the figure represent different years interval (2000-2005 = red, 2006-2016 = black, and 2017-2022 = blue). Out of the 23 soybean progress curves, 13 had 50% dates falling within a 9-day interval between May 13 and May 22 and 22 had 50% dates falling within a 17-day interval between May 13-30. Apparently, over the last 23 years 50% of soybean progress date varied year by year depending on other factors, which could be mainly related to weather conditions and logistics management. However, if we take a closer look to the last 3-years (2020-2022) compared to the interval between 2017-2019, it seems that in the last three years growers have been planting as early as manageable possible (<May 22).
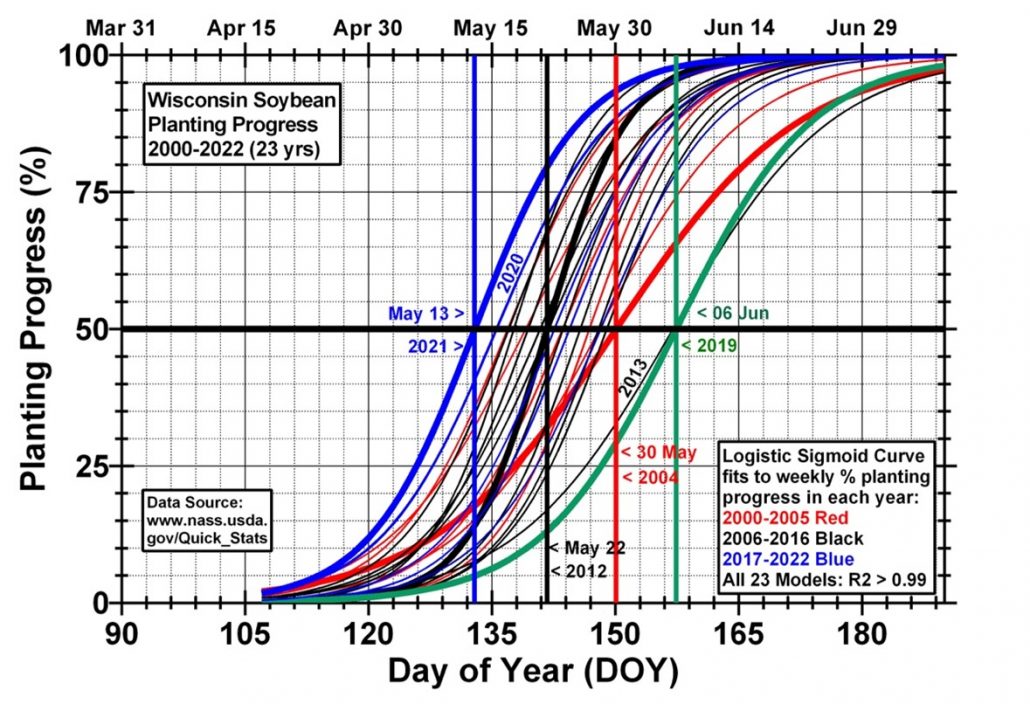
Figure 2. Historic record of 23 years of soybean planting progress in Wisconsin.
Trends in the 2000-2022 Wisconsin Soybean 50% Planting Progress Date
Figure 3 demonstrates the spring dates of 50% planting progress (circle dots) in relation to each year’s S-curve model generated by the logistic equation from 2000-2022. The minimum, maximum, and mean values for the spring 50% planting progress date are represented as black dashed horizontal lines in the figure. Over the last 23-years, there has been no clear indication that Wisconsin soybean 50% progress has been shifting for earlier planting. Since 2000, spring dates for 50% soybean planting progress have ranged from as early as May 13 (2021) to as late as Jun 6 (2019). If the late 2013 and 2019 spring dates are considered as outlier data points, the spring dates for 50% soybean planting progress ranged from May 13 (2021) to late May 30 (2004). As of the latest NASS May 7 estimate for 2023, Wisconsin soybean planting progress stands at 11%, which is 5% greater than at the same period last year in 2022.
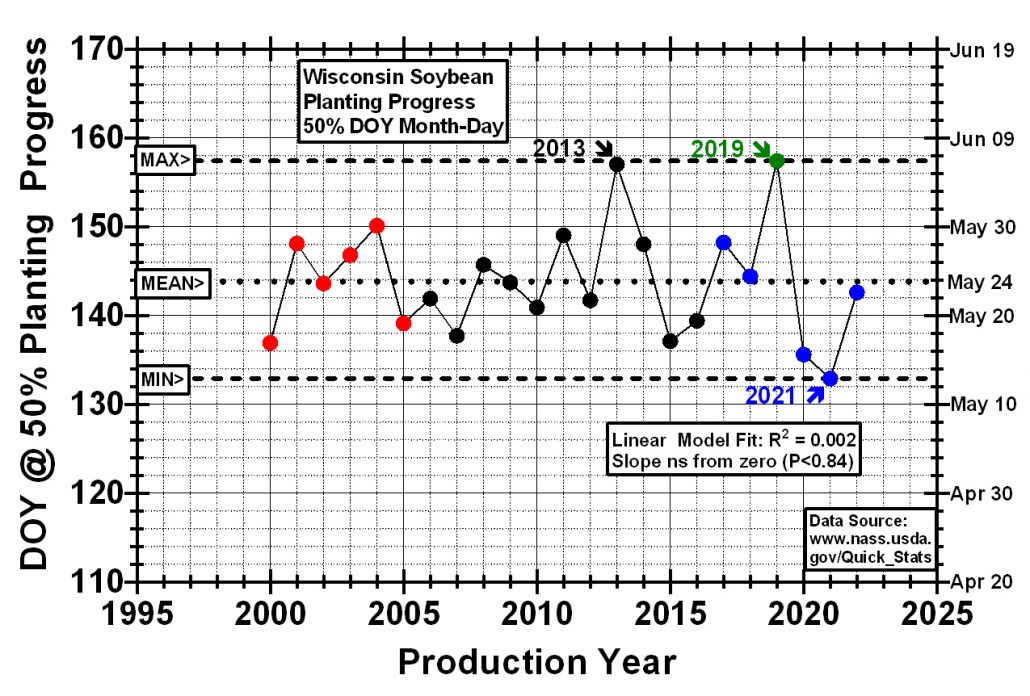
Figure 3. Variation of 50% soybean planting progress date in Wisconsin over the last 23 years.
Can the 50% Planting Progress Date be used to predict Wisconsin soybean yield?
Figure 4 represents soybean yield (vertical axis) and 50% spring dates (horizontal axis displays Day of Year at the bottom and Month-Day at the top). The solid green line denotes the linear regression considering all data points from 2000 to 2022. The dashed blue line displays the linear regression excluding the conjectured outlier years (2013 and 2019). The green trend line reveals that a one-day delay in the 50% progress date may potentially reduce soybean yield by 0.45 bu/ac. When the two extreme 50% soybean plant date years (2013 and 2019) were excluded from the regression analyses (green dashed trend line), the yield benefit reached 0.75 bu/ac per day. Thus, reaching the 50% planting progress point early in the season would enhance soybean yield.
Picking 2021 as one example, Wisconsin growers moved up the 50% soybean progress date by 11 days (May 13) in 2021 from a 23-year mean of May 24 (black vertical line). That 11-day change to earlier soybean planting in Wisconsin would have resulted 0.45 x 8 = ~ 3.6 bu/ac greater yield. It’s important to note that it’s not only the first soybean field that matters, but also getting the final field planted early for maximum yield benefit. So, if the conditions are favorable, it’s best to start planting as early and fast as you can manage.
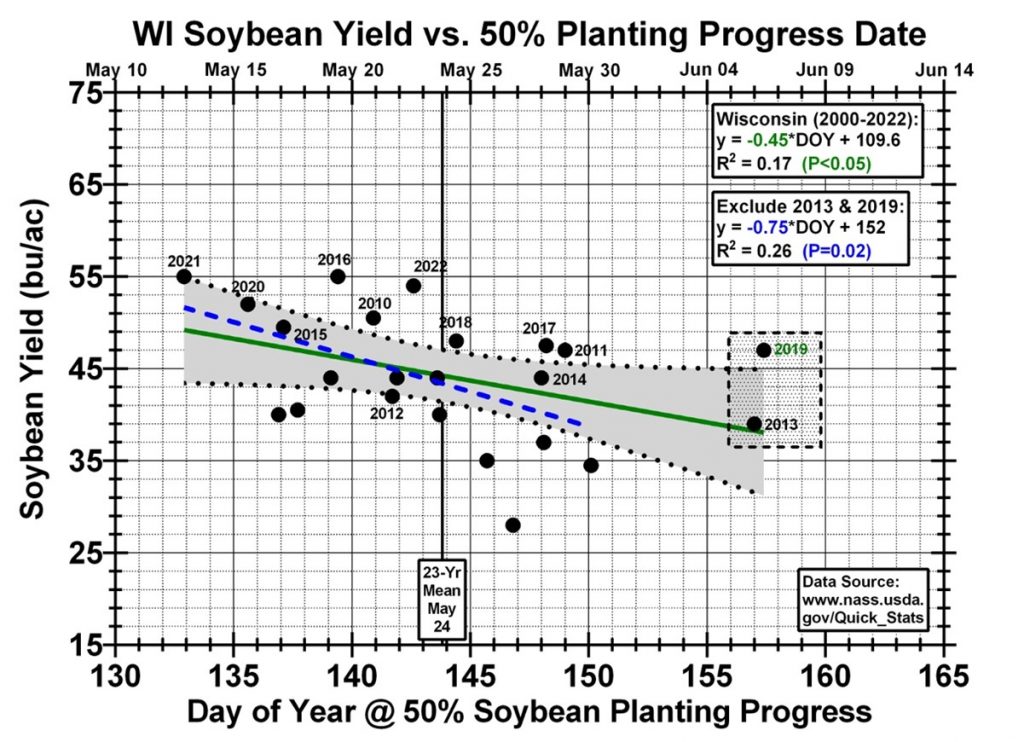
Figure 4. Correlation between soybean historical yield with 23-year 50% planting progress in Wisconsin.
Overall, these results are aligned with previously reports that support early planting to achieve high soybean yields (see here and here). Early planting is crucial for higher yields due to increase light interception, crop growth rate, node number, and consequent yield benefits. Planting soybean early can also be improved by planting longer maturity soybean varieties (see here). However, some risks come with this practice. For example, very early planting may be associated with higher early season frost risk or significantly reduced crop stands. Additionally, early planting should not be considered as a silver bullet that necessarily leads to high yield. Choosing best management practices, such as optimum maturity group, row spacing, seeding rates and applying proper herbicide programs are essential to lead to the expected higher yields and profit.