(SBOC)…..One MORE thing to think about this fall?

By: Seth Naeve and Shawn Conley

Fall is time where farmers literally reap the production of their year’s efforts, but fall can be a crazy and chaotic time as well.  Each year offers new challenges, and this one will be no different.

Farmers in the Midwest should be aware of an issue in the production system that may affect how their soybean deliveries may be handled.  The issue is related to soybean seed coat color and it is important that producers are aware of this prior to harvest.

Soybean seed coats can vary in color based on genetics of the seed, the environment where they are produced, or through infections by disease organisms.  The presence of colored seed coats is not uncommon and the U.S. Federal and Grain Inspection Service (FGIS) includes a measure of seed coat color in its soybean grading standards.  U.S. #1 yellow soybeans are allowed up to 1% soybeans of other colors (SBOC), a general term to note any soybean with off-colored seed coats.  U.S. #2 soybeans may contain up to 2% SBOC.

Following the 2021 harvest season, it became clear that Enlist E3® soybeans can produce soybean seed containing some off-colored soybeans, and the percentage of the seed with this SBOC appearance can be very large.  Not all varieties produce this trait, and this trait may not express itself in all fields.

By May, of 2022, around 32% of FGIS soybean certificates included SBOC of greater than 1%.  So, nearly 1/3 of soybean samples did not make US #1 yellow soybeans due to off-colored soybeans (Images 1, 2 and 3).  In previous years, fewer than 1% of soybean certificates failed to make US #1 due to SBOC (https://www.ams.usda.gov/about-ams/giac-june-2022-meeting).
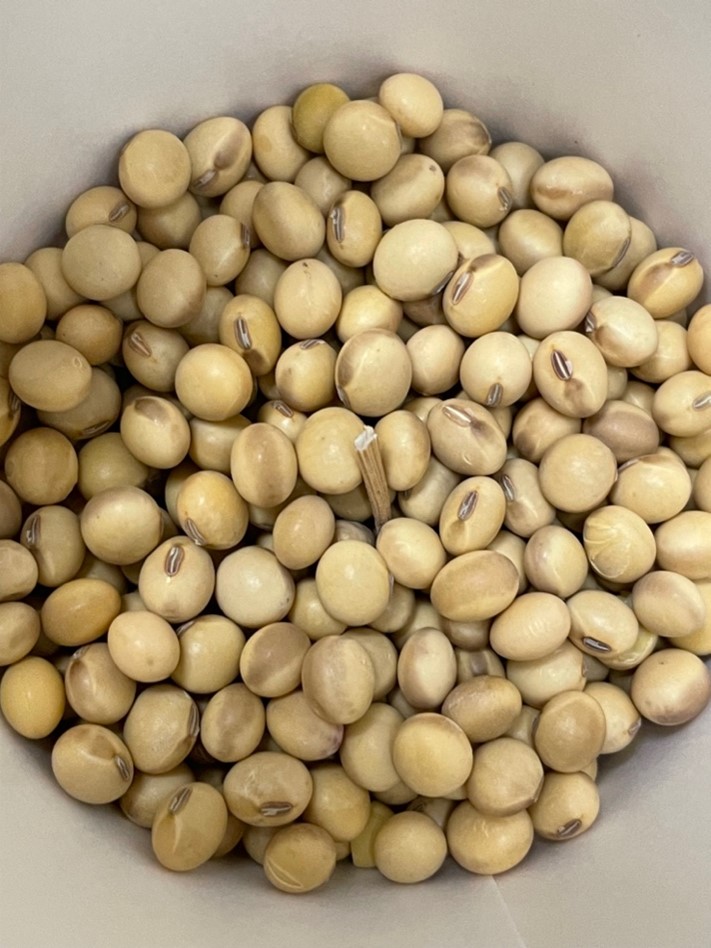
Image 1. Graded Grain Sample containing a high percentage of SBOC.
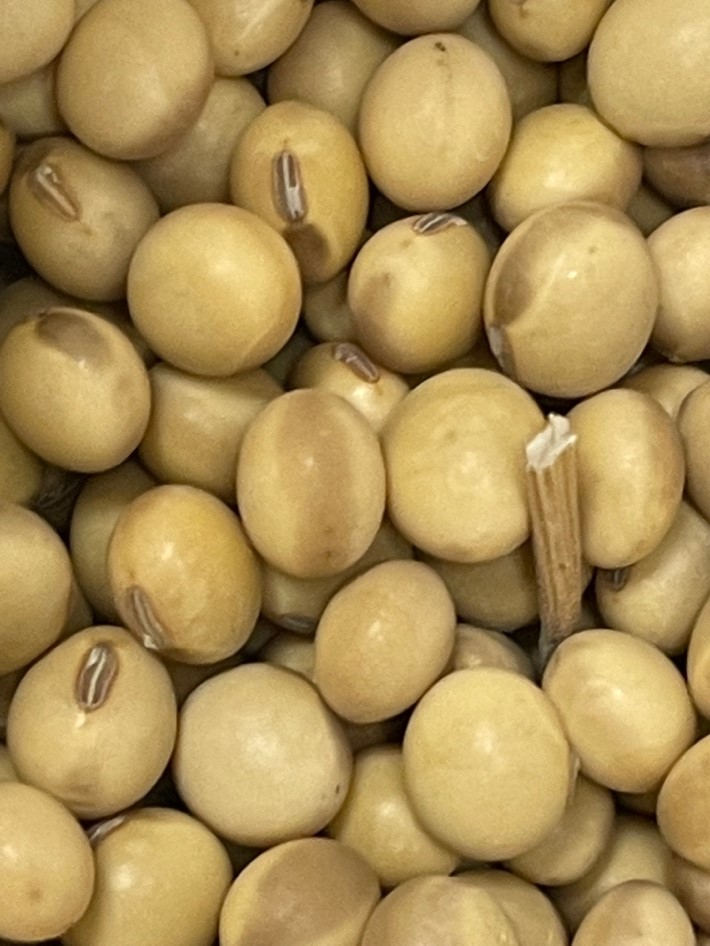
Image 2. Closeup of graded SBOC sample.
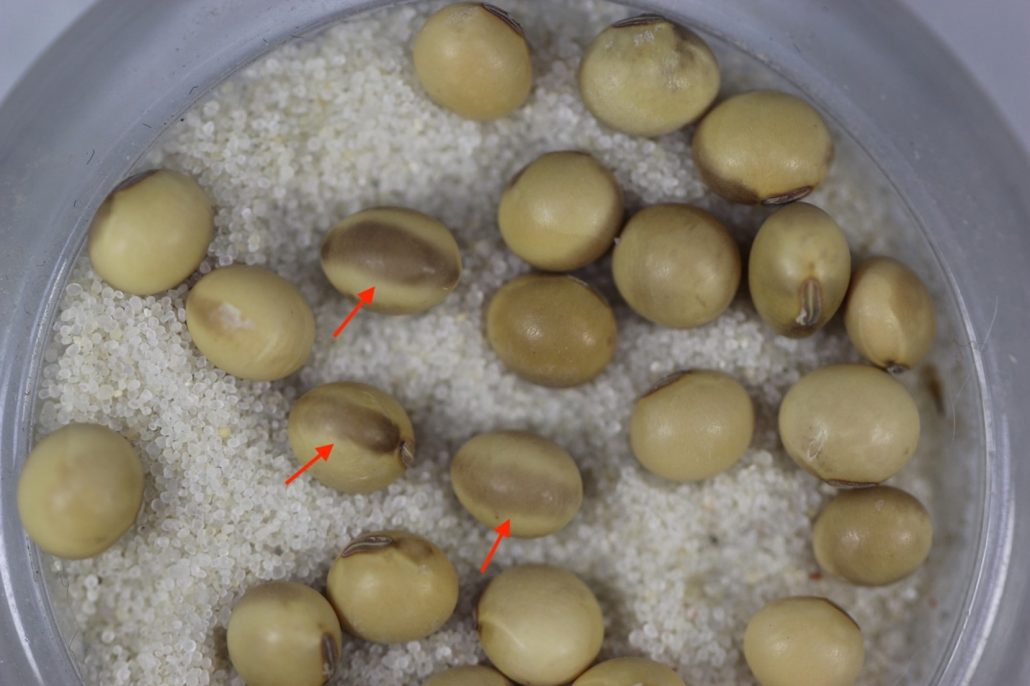
Image 3. SBOC Highlighted. Image from PJ Liesch.

From a practical standpoint, seed coat color is unlikely to have any effect on the quality of soybean meal or oil produced from these soybeans.  However, significant quantities of US soybeans are exported for food use.  Presence of these off-colored seeds in shipments destined for food use may lead to rejections at either the origin or destination of these shipments.  This increases risk for all in the value chain.

Currently, it appears U.S. soybean processors will be unlikely to implement dockage on soybeans containing over 1% SBOC.  However, elevators that have connections to overseas markets are likely to segregate soybeans by Enlist E3® vs other traits.  While direct dockage to producers may be uncommon, it is very possible that basis levels will be adjusted based on local supply and demand of soybeans for processing and soybeans for export.  Regardless of direct impacts, segregation of commodity soybeans into different markets reduces efficiencies and will lead to additional costs that must be borne by buyers or sellers of soybean.

If concerned, farmers should consider reaching out before harvest starts to their local elevators and/or seed dealers to determine how this issue may be handled locally.

Soybean Flowers, Herbicide Labels, and Wheel Track Damage…Oh My!

Authored by Shawn P. Conley and Rodrigo Werle

We are starting to get the many reports of soybean beginning to flower (R1) in our early planted situations. As we enter the soybean reproductive growth phase there are a few things to keep in mind. The first is that soybean will produce flowers for ~3 to five weeks, depending upon planting date and environment. During that time soybean will abort anywhere from 20 to 80% of the flowers that they produce. Generally it is the first and last flush of flowers produced that are most likely to be aborted.

R1 soybean growth stage

Next, the timing window for many POST-emergence herbicide applications in our early planted soybean are quickly closing if not closed already. Glyphosate labels indicate that applications can be made through R2 or full flower, however the spread of glyphosate-resistant waterhemp and other weeds across Wisconsin and beyond has led several farmers to adopt soybean varieties containing the novel herbicide resistance traits (Xtend [which confers resistance to glyphosate and dicamba],Xtendflex [which confers resistance to glyphosate, dicamba and glufosinate], Enlist E3 [glyphosate, glufosinate and 2,4-D] or LibertyLink GT27 [glyphosate and glufosinate]), which all provide effective herbicide options for POST-emergence broadleaf weed control. The application window for the POST-emergence herbicides associated with the aforementioned traits is also linked to soybean reproductive growth stages.

In Xtend systems, the registered dicamba herbicides Engenia and XtendiMax with VaporGrip Technology can be applied in Wisconsin until June 30 or up until R1 (first bloom; in other words, don’t apply if the soybeans are flowering), whichever comes first. Tavium plus VaporGrip Technology may be applied through the V4 growth stage or prior to June 30, whichever comes first.

In LibertyLink systems (LL, LLGT27, Enlist E3, or XtendFlex), glufosinate herbicides such as Liberty, Interline, etc. can be applied up to bloom or R1 growth stage (don’t apply if the soybeans are at R2 stage or advanced).

In Enlist E3 systems, the registered 2,4-D herbicides Enlist One and Enlist Duo should be applied through R1 growth stage.

When deciding the best time for a POST application, target small weeds, follow all label requirements and don’t spray under adverse environmental conditions.

Soybean developmental note: on average it takes ~ 4 days to move from R1 (beginning flower) to R2 (full flower) and ~10 days from R2 to the start of R3 (beginning pod).

Last but not least, wheel track damage made from ground applications may start to reduce yield. Sprayer wheel traffic from first flower (R1) through harvest can damage soybean plants and reduce yield (Hanna et al. 2008). Our research suggests that an adequate soybean stand (more than 100,000 plants per acre) planted in late April though mid-May can compensate for wheel tracks made when a field is sprayed at R1. Yield loss can occur, however, when wheel tracks are made at R1 or later in thin soybean stands (less than 100,000 plants per acre) or late planted soybeans. Regardless of stand, plants could not compensate for wheel tracks made at R3 (early pod development) or R5 (early seed development). The average yield loss per acre is based on sprayer boom width (distance between wheel track passes). In our trials yield losses averaged 2.5, 1.9, and 1.3% when sprayer boom widths measured 60, 90, and 120 foot, respectively. Multiple trips along the same wheel tracks did not increase yield loss over the first trip.

Spraying soybean at the R1 crop growth stage
Wheel track damage to drilled soybean at R1

Hanna, S., Conley, S. P., Shaner, G., and Santini, J.  2008.  Fungicide application timing and row spacing effect on soybean canopy penetration and grain yield.  Agronomy Journal: 100:1488-1492.

Soybean Replant Decisions: Just the Facts Jack!

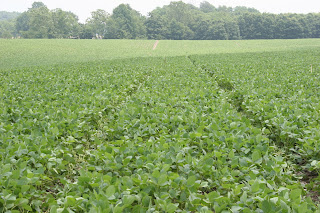
The start of the #plant22 growing season has been significantly less favorable than #plant21 for many Midwestern farmers. According to today’s NASS report for WI: Soybean planting was 26 percent complete, 9 days behind last year and 2 days behind the average. Soybeans emerged was 1 percent, 12 days behind last year and 8 days behind the average. Today we are starting to see the first wide spread images of soybean beginning to crack and emerge in WI. As farmers, agronomists and technical service providers begin to assess the 2022 soybean stands here are a few items to contemplate before re-plant recommendations are made.

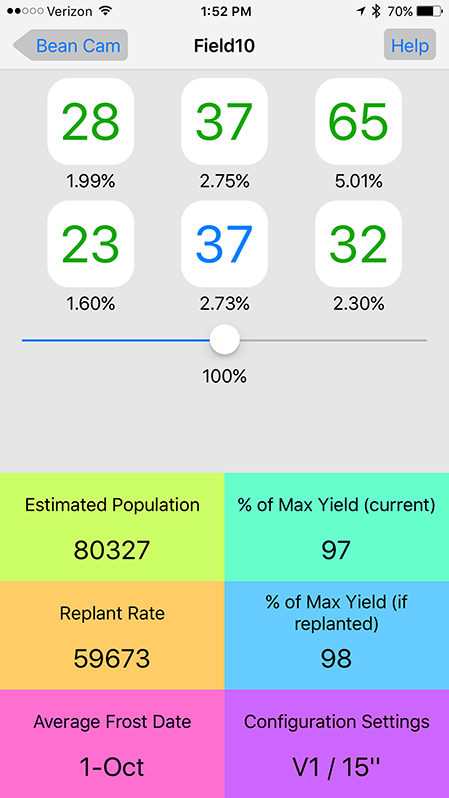
  1. Get an accurate stand assessment. We are often drawn to the worst areas of fields and over-blow how bad the overall stand really is. You can go old school and use the tape or hula-hoop method or try a digital approach such as Bean Cam the WSMB funded soybean replant app!
    1. Link to the app store for iPhone and iPad
    2. Link to the app store for Android

      Bean Cam app calculations/results.

  2. An effective stand is obviously important to maximize soybean seed yield. However the downside yield risk for a sub-par stand is minimal until stands fall below 50,000 plants per acre. The synergy of early planting coupled with breeders adding 3x yield to soybean branches at low populations have effectively reduced the yield penalty for thins stands by 1/2 (Suhre et al. 2014) . Therefore we recommend the following.
    • Early planted soybean yield is maximized with stands that range from 100,000 (high yield environment) to 135,000+ (low yield environment) plants per acre.
    • When soybean stands are less than 50,000k plants per acre, inter-plant new seed with a similar maturity into the existing stand. DO NOT TEAR UP THE STAND AND START OVER.
    • When stands fall between optimal and 50,000k plants per acre Think Twice Before Replanting Soybeans! Our data shows a nominal ~2 bu yield increase in this situation. Even if you have a “free replant” guarantee the numbers don’t make economic sense. As a grower you are better off investing $$$ in an effective in-season residual herbicide to control weeds such as Palmer and waterhemp.

References:

Gaspar, A. and S.P. Conley. 2015. Responses of canopy reflectance, light interception and soybean seed yield to replanting sub-optimum stands. Crop Sci.55: 377-385. doi: 10.2135/cropsci2014.03.0200

Suhre, J.J., Weidenbenner, N., ‡Rowntree, S., Wilson, E., S., Naeve, S. Casteel, S.P. Conley, Diers, B., Esker, P., Specht, J., and Davis, V. 2014. Soybean Yield Partitioning Changes Revealed by Genetic Gain and Seeding Rate Interactions. Agron. J. 106:1631–1642.

Winners of the 2021 WI Soybean Contest are Announced

Division 4:

1st           Ron Digman, Mount Hope (107.19 bu/a with Pioneer P28A42X)

                     *Inducted into WI 100 Bushel Soybean Club

 2nd          Don and Doug Midthun, Arlington (97.95 bu/a with Asgrow AG20X9)

Division 3:

1st           Jim Salentine, Luxemburg (97.57 bu/a with Stine 20EB23)

–Only one entry was submitted for Division 3–

Division 2:

1st           Scott Peavey, Woodville (98.34 bu/a with Asgrow AG11X8)

2nd          Mike and Dean Wegner, Sparta (79.43 bu/a with Pioneer P18A33X)

Division 1: 

1st           Jim Wilson, St. Croix Falls (80.09 bu/a with Asgrow AG11X8)

2nd          Josey Wilson, St. Croix Falls (76.15 bu/a with Pioneer P16A84X)

Soybean Quality Contest

1st           Jim Salentine, Luxemburg (3,085 pounds of protein plus oil per acre with Stine 20EB23)

The contest is sponsored by the WI Soybean Program and organized to encourage the development of new and innovative management practices and to show the importance of using sound cultural practices in WI soybean production.

For more information please contact Shawn Conley, WI State Soybean Specialist at 608-800-7056 or spconley@wisc.edu

Best Management Practices for Growing Second or Third Year Soybean

Originally Coauthored by: Shawn P. Conley, Seth Naeve and John Gaska December 14, 2016. Modified by S.P.Conley 1/22/18.

Modified by S. P. Conley, E. G. Matcham, and L. C. Malone 12/15/2021.

Before we start, we fully acknowledge our title “Best management practices for growing second or third year soybean” is a bit misleading as we do not advocate this practice (it’s not a BMP!) but we thought we could sucker you into reading this article if it had an enticing title!

This article was originally updated in 2018 when the USDA announced that U.S. soybean acres in 2018 will surpass U.S. corn acres. These acres have to come from somewhere and many of them will be from second-year soybean.With input costs rising rapidly, especially for nitrogen fertilizers, we thought it was time for another update. Many of our management recommendations remain the same, but we also have some additional recommendations based on recent crop rotation and nutrient management research.

With that being said, here are some recommendations to consider:

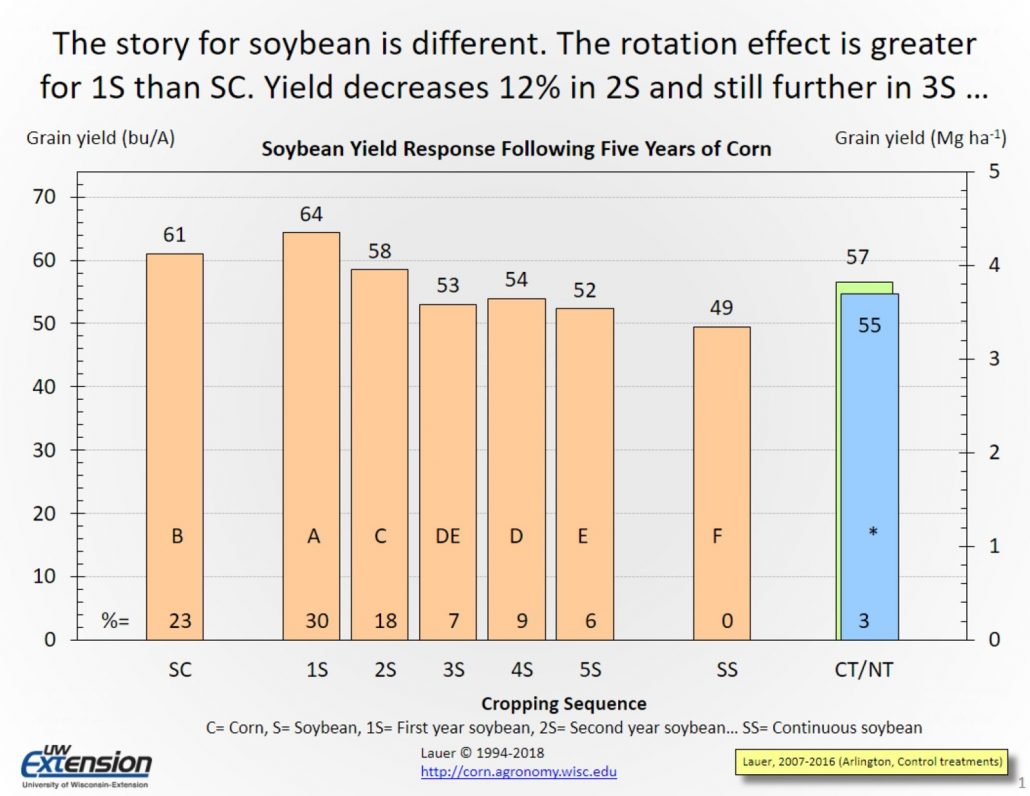
  • Balancing short-term versus long-term profitability (i.e., economic sustainability). Every year promises of short-term profitability may drive some farmers to consider planting soybean after soybean, rather than rotating, data from our long -term rotation experiment clearly shows the benefit of crop rotation to the soybean crop. It is amazing that after 5 years of corn, it only took 3 years of continuous soybean for the yield to drop to within 7% of continuous soybean (20+ years) yield levels whereas 2nd year soybean yielded within 5% of soybean in a corn-soybean rotation. We could hypothesize then that the yield of the 3rd year of continuous soybean (in our experiment) would be like a 2nd year of soybean in a corn soybean (C-S-S) rotation. Our data clearly shows that 3 or more years of continuous soybean gives you a 7+ bu per acre hit when compared to a corn-soybean rotation and moves you close to the yield levels of continuous soybean. In short, you are setting your long-term profitability up for a hit. Another long-term rotation study we have (19 years) shows an even bigger yield benefit (13%) to rotating away from soybean for two years (corn and wheat) compared to annually rotating corn and soy.

  • Be aware that soybean after soybean will alter the pest relationship complex in your fields. Some of these alterations may take years to undo as you will be making a long-term impact on your soil and resulting soil health. We looked at soil fungi in our long-term rotation study and found increased Fusarium (which causes damping off in soybean) in continuous soybean plots. On the “good microbes” side of things, soybean isn’t a great host of AMF, a fungus that helps take up water and phosphorus, and rotating away from better hosts like corn for more than a year can decrease AMF populations in your field that other crops might benefit from. Read more about this soil fungi data here.
  • Also don’t automatically think that simply adding a cover crop to this S-S rotation will “fix” these issues. In an Ohio study, rye cover crops only increased yields by 2-6 bu/acre and did not impact disease or insect pressure compared to control plots without cover crops.
  • Plant a different variety than was planted in that field the previous year and make sure it has strong disease resistance traits to the problems you have in that field! Every variety has a weakness and planting the same variety on the same land 2 years in a row will expose that weakness. Note that these varieties must be truly different.  The same bean in a different color bag will greatly increase your risk of disease losses.  Please see our 2021Wisconsin Soybean Variety Performance Trials for information.
  • Test for SCN and select SCN resistant varieties. SCN proliferates in long-term soybean cropping systems. Control weeds that are alternate hosts for SCN like field pennycress, shepherd’s-purse, and chickweed and do not plant leguminous cover crops that can be an alternative host for SCN. Be prepared to scout your fields more intensively to get ahead of any disease problems. Increased disease pressure is likely to be more pronounced in no-till fields and may provide an opportunity to see yield responses from fungicides and insecticides. Include the cost of additional crop protection applications in your economic estimates for short-term profitability.
  • Keep seeding rates lower if white mold was a problem in the field
  • Use a seed treatment at the max a.i. fungicide rate.
  • Use a pre-emergence herbicide and use multiple modes of action. If you had weed escapes, expect even larger problems in soybean after soybean.
  • Soil sample and replace K if needed: An 80-bushel soybean crop meant you removed ~98 pounds per acre of K20 equivalent fertilizer. Growers often routinely rely on carryover fertilizers for soybean when rotated with well-fertilized corn. Soybean after soybean may require additional fertilizer, especially K.

Back on the soil microbe note, we looked at the soil bacterial communities under corn-soybean rotation (5 years of corn followed by 5 years of soybean). These communities are affected by a lot of factors, like pH, moisture, and nutrients, along with the plants growing there. The figure below shows ordinations of bacterial communities – each point on the graph is a plot in our field experiment, and the further apart points are, the more different those communities are. This figure focuses on soybean phases. The main point here is that the first and second year of soybean after 5 years of corn are pretty similar to each other, while the 3rd, 4th, and 5th year of soybean start to look more like the continuous soybean (30+ years). This trend might remind you of the yield trends discussed earlier in this post! Bulk soil microbial communities are complicated, and they take a long time to change…sticking with soybean for one extra year may not shift the community drastically, but 3+ years is more likely to. The data from this study isn’t published yet, but if you are curious about bacterial communities and corn/soybean rotation in the soil you can read more here.

Additional recommendations for years 3+:

  • Even if you only saw an increase in disease pressure without an increase in insect pressure in year 2 beans, expect to see an increase in both diseases and insects in year 3+. Budget accordingly for crop protection products.
  • Consider increasing your seeding rate in fields with high pressure for seedling diseases such as pythium or phytophthora. Don’t increase your seeding rate in fields with high white mold pressure.
  • Soybean removes more K and S per acre than corn. Consider increasing soil sampling frequency to monitor K levels, and scout fields regularly for S and micronutrient deficiencies.

Finalists for the 2021 WI Soybean Yield Contest are Announced

The finalists for the 2021 WSA Soybean Yield Contest were announced today.  The top two entries in each division (in no particular order) are:

Division 4:

  • Ron Digman, Mount Hope (planted Pioneer P28A42X)
  • Don and Doug Midthun, Arlington (planted Asgrow AG20X9)

Division 3:

  • Jim Salentine, Luxemburg (planted Stine 20EB23)

*Only one entry was submitted for Division 3

Division 2:

  • Scott Peavey, Woodville (planted Asgrow AG11X8)
  • Mike and Dean Wegner, Sparta (planted Pioneer P18A33X)

Division 1: 

  • Jim Wilson, St. Croix Falls (planted Asgrow AG11X8)
  • Josey Wilson, St. Croix Falls (planted Pioneer P16A84X)

The Soybean Quality Contest was optional for any Soybean Yield Contest entrant.  There are no geographical divisions for the Quality Contest.  One cash award will be presented statewide to the highest protein plus oil yield per acre (measured in lbs. per acre).

  • Jim Salentine, Luxemburg (planted Stine 20EB23)

*Only one grain sample was submitted for the Soybean Quality Contest.

The final ranking and awards will be presented at the Corn Soy Expo to be held at the Kalahari Convention Center, Wisconsin Dells on Thursday, February 3rd, during the WSA/WSMB annual meeting.

The contest is sponsored by the WI Soybean Program and organized to encourage the development of new and innovative management practices and to show the importance of using sound cultural practices in WI soybean production.

For more information please contact Shawn Conley, WI State Soybean Specialist at 608-800-7056 or spconley@wisc.edu

Mirror, Mirror on the Wall, Will My Wheat and Soybean Crop Freeze and Fall?

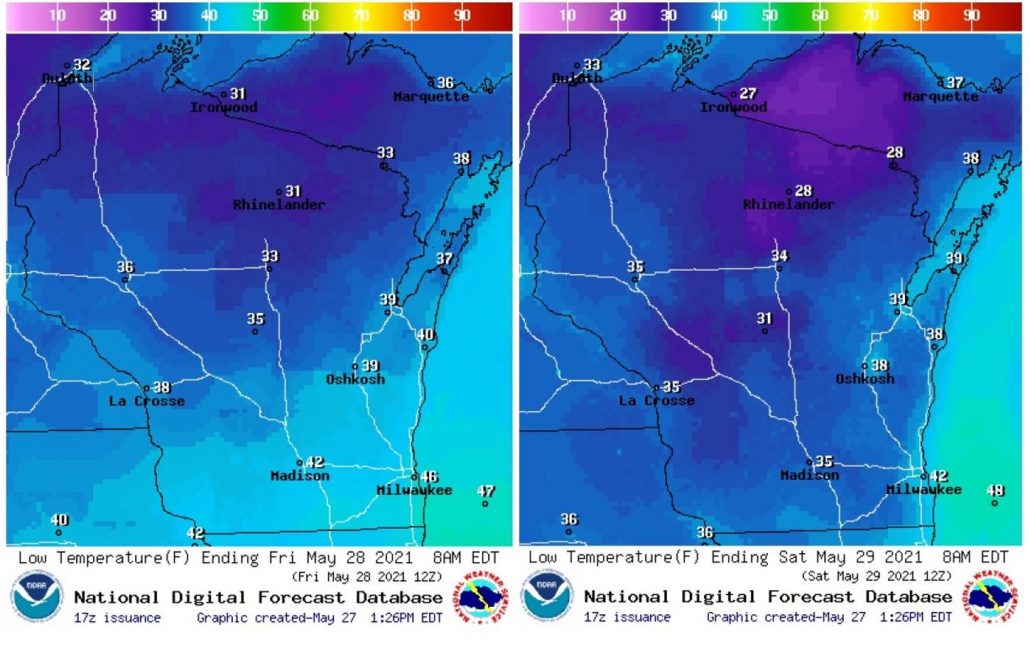
Well folks its the end of May and frost is in the air. I figured we would be getting some questions about the impact of the predicted cold temperatures on the wheat and soybean crop. Here is my coolbean take!

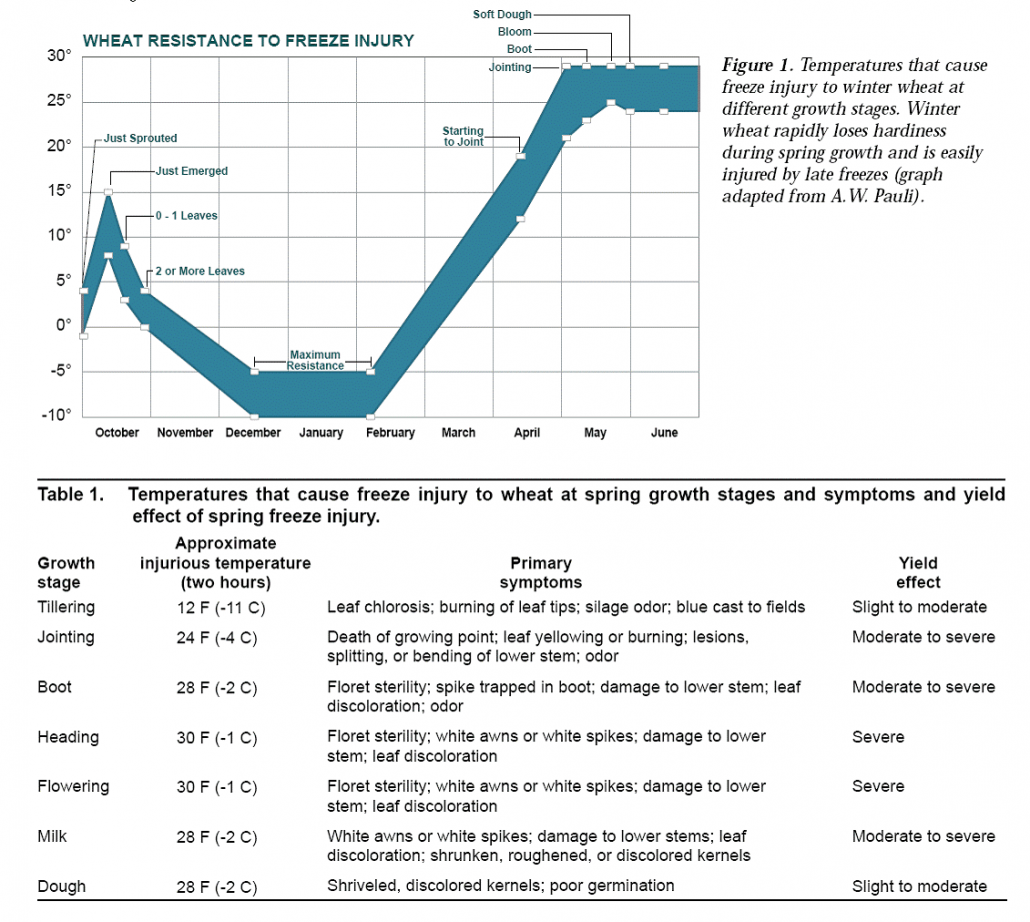
First lets start with the wheat crop which in WI ranges from boot to anthesis. Cold temperature would need to reach 30 degrees F or less for 2 plus hours before injury occurred. I just don’t see that happening in any major wheat growing region in WI this week.

Table 1. Wheat Resistance to Freeze Injury (From: Spring Freeze Injury to Kansas Wheat)

Now let’s talk about soybean. I am also optimistic that if the forecast temperatures hold, the soybean crop will in fact be #COOLBEANS, but also unaffected. My optimism lies in the Nowledge I received in an email from Dr. Jim Specht from UNL a few years ago (modified slightly by me for context). For the most-part, farmers and their soybeans in WI fall within the context of this email.

First of all  temps above 32F will not impact above-ground tissue.  Second, tissue freezing does not even take place at 32F because cell cytoplasm has solutes in it – like a modest anti-freeze, which depresses freezing point of the tissue a degree or two less than 32F – thus air temps surrounding the tissue have to get to below 31 or 30F before tissue freezing can occur.  Third, the soil surface is typically warmer than the air temperature (particularly when the soil is wet) and does not give up heat acquired during a sunny day as fast as the air does after sunset.  In actuality, the interface between soil surface temp and the air temp near that soil surface will be closer to the soil temp than to the air temp which most peopled measure on thermometers viewable at their height (not at ground level).  Biophysically, control of the soil temp over the air temp this is called the “boundary layer effect”).  So don’t trust air temperatures read on thermometers unless you know what the air temperature near the soil surface was (put a thermometer on the soil surface where the cotyledons are and check it just before dawn (when the soil surface temp reaches its nadir for a 24-hour temperature cycle).  Fourth, the cotyledons are a huge mass of tissue that are about 95% water.  That big amount of water-filled tissue is hard to freeze unless the exposure to temps of 30F at the soil-air interface is many, many hours.  Cotyledons will freeze faster (in fewer hours) but only if the soil surface temps get well below 30F (say 25F).  The only concern I would have is when cotyledons are no longer closed and protecting the young stem tip.  However, if that is in fact frozen off, the nodes to which the cotyledons are attached will regenerate TWO main stem tips.  Not an ideal way to start the growing season, but better than having to replant (0.5 bu/ac loss per each day that soybeans are NOT in the ground on May 1). Text courtesy of Dr. Jim Specht (UNL)!

For additional information please view my YouTube video that discusses common early season emergence issues (including frost injury) and just in case the forecast was way off and we get hammered with colder than expected temperatures here is our replant article entitled:

Soybean Replant Decisions: Just the Facts Jack!

The WSMB Free Soybean Cyst Nematode Testing Program is Back in 2021!

Ann MacGuidwin, Damon Smith and Shawn P. Conley

The WI Soybean Marketing Board (WSMB) sponsors free nematode testing to help producers stay ahead of the most important nematode pest of soybean, the soybean cyst nematode (SCN). Eggs of SCN persist in the soil between soybean crops so a sample can be submitted any time that is convenient. The soil test report indicates the number of eggs in the sample and is useful for selecting the right variety for the next soybean crop. Retests of fields planted with SCN-resistant varieties over multiple years shows how the nematode population is responding to variety resistance and provides an early warning should the nematode population adapt to host genetics.

In the spring of 2012, the WSMB expanded the nematode testing program to include other pest nematodes in addition to SCN. These nematodes are less damaging to soybean than SCN but can cause enough yield loss to warrant treatment. As is the case for SCN, there are no rescue treatments for nematodes so the primary purpose of this year’s soil test is to plan for next year’s crop. Soil samples collected in corn for nematode analysis have predictive value for explaining yield if they are collected before the corn V6 growth stage. Sampling early in the season will provide information about the risk potential for the current corn crop AND the next soybean crop.

The assays used to recover nematode pests other than SCN in soil require that the nematodes are alive. So, it is important to keep the samples moist and at least room temperature cool. Collecting a sample that includes multiple cores ensures that there will be plenty of root pieces to assay. It is not necessary to include live plants in the sample. The soil test report will indicate which pest nematodes are present and at what quantities and their damage potential to soybean and corn based on the numbers recovered.

For more information on SCN testing and management practices or to request a free soil sample test kits please contact: Jillene Fisch at (freescntest@mailplus.wisc.edu).

Click to view more information on our WI SCN testing program or visit The SCN Coalition.

Remember the first step in fixing a nematode problem is to know if you have one! The WSMB sponsored nematode testing program provides you that opportunity. So Wisconsin farmers….”What’s you number?”

Lab Methods for Soil Testing

Article written by: Emma Matcham, Matt Ruark, and Shawn P. Conley

We talk a lot about the importance of soil sampling, but we don’t spend much time talking about what happens to your samples after you send them off to the lab. There are a few different procedures for measuring potassium (K) and phosphorous (P), and knowing which method was used to analyze your samples can help you accurately interpret the lab results.

All methods we’ll discuss today for measuring P and K share some general steps. Soil arrives at the lab, receives a sample ID, and then is dried in an oven, ground, and passed through a 2mm sieve. Then the soil is mixed with an extractant that removes a portion of the nutrients from the soil itself, and then the nutrient concentration of the solution is measured. One common misconception about nutrient extraction is that these tests remove all the P or K in a sample. Extraction only removes a portion of the total nutrients in the sample. Different tests extract a different proportion of the overall nutrients, which affects lab results and soil test interpretation. Both P and K are usually in the form of cations, or positively charged ions, in the soil.

Both Bray-1 and Mehlich-3 extraction solutions are acidic, but the acids in Mehlich-3 extraction solution are weaker. In alkaline soils, using acids to extract cations from soil doesn’t work particularly well. Instead, states like Minnesota and others in the western US use the Olsen test to extract P with weak sodium bicarbonate.

While most of you will never need to know the precise details of the different extraction methods, we think it’s important to understand that there are different methods, and they all work a little differently. Since none of these methods remove truly all of the cations in the sample, if you run the same sample using two different methods you will get two different values.

State nutrient recommendations are built with specific tests, and you will be better able to implement the recommendations of A2809 or your state’s nutrient guidelines if you make sure your samples are run using the same methods as your state guidelines. The good news is that nearly all commercial labs can run your samples using any of the methods described above. If farming outside of Wisconsin, check your state nutrient guidelines and the soil test they are based off of before you pull your soil samples. Then, write that method or check the box corresponding to the correct test on the submission form when you mail samples off to the lab.

If you have past soil samples that were tested using methods that differ from your state’s recommendations, you can convert because the different methods are highly correlated. The conversions for P are simple. Ohio State recommends dividing your Mehlich-3 P number by 1.35 to get a Bray-1 P value. This conversion is similar to conversions provided by Iowa State, and it should hold true for WI soils too. Olsen P can also be converted to Mehlich-3 P, using conversions from Ohio State.

The conversions for K are a little more complicated, since the sample’s clay content can affect K extraction. Dr. Carrie Laboski in the Soil Science Department at UW-Madison has done some work to correlate Bray-1 K with Ammonium Acetate K, and has found that multiplying Bray-1 K by 1.2 is a good way to estimate Ammonium Acetate K on silt loam soils (personal communication with Dr. Laboski). For sandy soils, she found that Bray-1 K and Ammonium Acetate K are approximately equivalent.

Unfortunately, there is not a published conversion between Bray-1 K and Mehlich-3 K. Ohio State converts from Mehlich-3 K to Ammonium Acetate K by dividing by 1.14, and you can theoretically combine the Bray-1 K to Ammonium Acetate K conversion from Dr. Laboski with the Ammonium Acetate K to Mehlich-3 K conversion from Ohio State to estimate them too. This “double conversion” method suggests you can divide Mehlich-3 K by 1.368 to get Bray-1 K. It’s usually not a great idea to combine conversions across different states like this, but it is the best option currently available.

Figure 1: Scatterplot comparing Bray- 1 K and Mehlich-3 K extraction methods, with linear regression line. Bray-1 K = 0.77 * Mehlich- 3 K – 0.75 (R2 = 0.91, p < 0.001)

Figure 1: Scatterplot comparing Bray- 1 K and Mehlich-3 K extraction methods, with linear regression line. Bray-1 K = 0.77 * Mehlich- 3 K – 0.75 (R2 = 0.91, p < 0.001)

We are currently building a data set of Wisconsin K soil samples that have been run using Mehlich-3 and Bray-1 K. From 108 samples of loam and silt loam soils in southern WI, you can see that the extraction methods are highly related (R2 = 0.91, p < 0.001) (Figure 1).  A simple linear regression from this data set indicates you can get from a good estimate of Bray-1 K by multiplying Mehlich-3 K by 0.77 and subtracting 0.75. The data presented in Figure 1 should be considered extremely preliminary because all the samples came from three fields within the same county. That said, this data does show that simple linear regression is likely to help us develop a conversion once we have a larger data set.

It’s also interesting to note that both the regression and double-conversion method yielded very similar estimates of Mehlich-3 K from the Bray-1 K test results for these samples. But, all the samples in our data set so far were on loamy soils near or within the optimum range where we don’t expect to see a yield response to K fertilizer. Future data sets will need to be larger and more diverse so that we can understand the relationship between extraction methods on low-K soils and other soil textures. In the long term, accurate conversions between extraction methods can help us better utilize historical and multi-state data, adding value for farmers across the Midwest.

Winners of the 2020 WI Soybean Contest are Announced

The 1st place winner in Division 4, Midthun Bros of Arlington, grew Asgrow AG20X9 and harvested 105.18 bu/a.  Midthun Bros also won the 100 Bushel Award.  In second place, Digman Ridge Farms of Mount Hope grew Pioneer P28A42X and harvested 98.29 bu/a.  In Division 3, Thelen Sand & Gravel harvested 90.22 bu/a with Pioneer P24A80X and in 2nd place, Farm Hill Acres of Elmwood harvested 80.60 bu/a with Pioneer P16A84X.  In Division 2, Prairie Grain LLC achieved 82.14 bu/a from Pioneer P16A13X for first place.  In 2nd place, Wegner Farms of Sparta harvested 81.32 bu/a from Pioneer P23A15X soybeans.  In Division 1 at 71.96 bu/a was Paul Graf Farms LLC who planted NK S14-U9X Brand.  2nd place winner in Division 1 was Jim Wilson of St. Croix Falls with 71.74 bu/a from Asgrow AG10X9.

RnK DeVoe Farms of Monroe was the winner of the Soybean Quality contest with 3,140 pounds of protein plus oil per acre from Pioneer P28A42X.

The contest is sponsored by the WI Soybean Program and organized to encourage the development of new and innovative management practices and to show the importance of using sound cultural practices in WI soybean production.

For more information please contact Shawn Conley, WI State Soybean Specialist at 608-800-7056 or spconley@wisc.edu